Foreign investment: a closer look at global trends

Blog
12 September 2025

Geographical shifts in foreign direct investment have been modest—but noticeable.

Our Economic Research has often emphasised the important contribution financial services makes to the UK’s foreign investment position. For example, in our latest ‘Key Facts’ report, we noted that over 2020-23, cumulative inflows of financial services foreign direct investment (FDI) totalled £51.2bn—which was equivalent to 50% of overall inward FDI. This meant that financial services attracted more foreign investment during that period than any other sector.

Cumulative inward FDI flow by top sector, £bn, 2020-2023*
Source: Office for National Statistics


*2019 data is classed as ‘confidential’
Note: A negative sign indicates a net disinvestment in the UK which means that direct investment interests were sold, and/or reinvested earnings were negative

FDI flows reflect the distribution of global capital; as such, they are related to countries’ economic weight in the world. In this blog post, I explore how global FDI patterns have evolved over the past decade. We have used IMF data[1] to examine whether the distribution of the stock of FDI[2] has kept pace with broader changes in global economic weight. Our initial, indicative analysis compared FDI stock in key country groupings—Advanced Economies, Emerging Markets and Developing Economies—between 2009 and 2023.[3] Our main findings are:

  • the vast majority of the world’s FDI stock—which totalled $4trn in 2023—is in Advanced Economies
  • that FDI was sourced, in the main, from other Advanced Economies, and
  • this dynamic changed only marginally between 2009 and 2023.

FDI flows among Advanced/Emerging/Developing economies (2009 left-and side, 2023 right hand-side)
Source: TheCityUK calculations based on IMF data


Note: visualisation represents Outward Direct Investment liabilities (gross), debt instruments, all entities.

The most noticeable change is the weight of Emerging Markets (represented in the charts above in green) in global FDI. In 2009, Emerging Markets were the source of only 2% of the global stock of FDI; by 2023 this had increased to 6%. This was because of a 10-fold increase in dollar terms, from $22bn in 2009 to $225bn in 2023.

It is important to emphasise that this analysis is indicative. The data presented here reflect official data reported by countries to the IMF—but participation is voluntary. In particular, the negligible values for Developing Economies are likely to reflect a lack of data, or a lack of reporting.

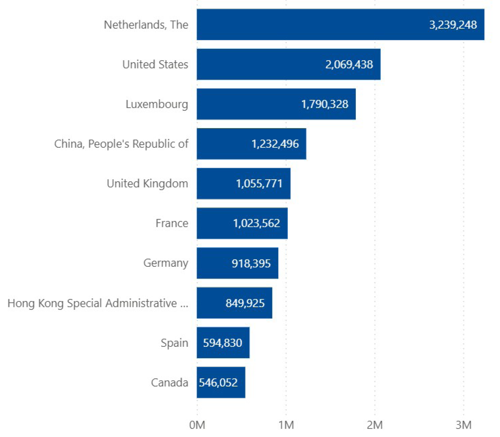
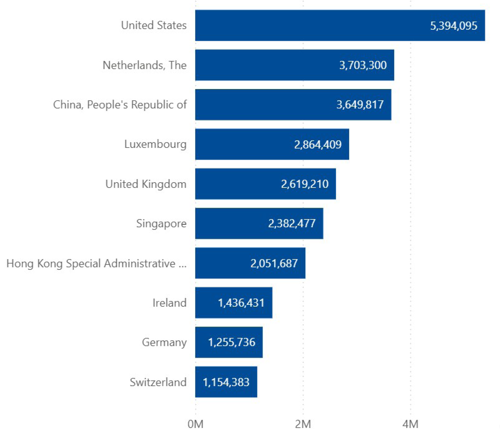
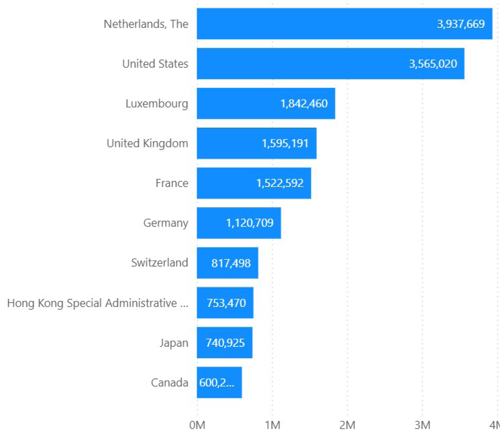
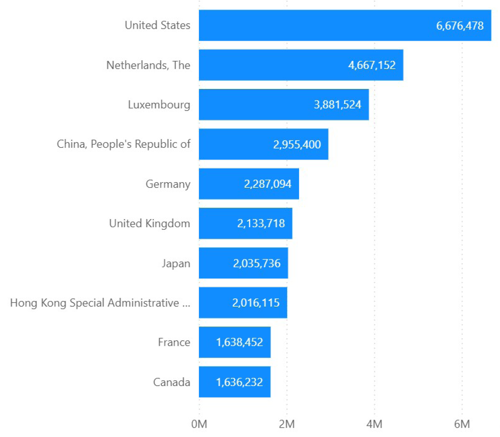
China, with its unparalleled economic growth and concurrent reshaping of global manufacturing and investment structures, is a significant part of the Emerging Markets story. The charts below show that in 2023, China was the world’s fourth-largest source of FDI.

Inward Direct Investment Positions, 2009
Top 10 reporting economies, US$m

Inward Direct Investment Positions, 2023
Top 10 reporting economies, US$m

Outward Direct Investment Positions, 2009
Top 10 reporting economies, US$m

Outward Direct Investment Positions, 2023
Top 10 reporting economies, US$m

Source: IMF

In terms of the destination of investment, many factors have driven an increase in the stock of FDI in Emerging Markets. For example, an explosion of interest in critical minerals in recent years, driven partly, though not exclusively, by net-zero carbon emissions targets, has triggered increased FDI flows into resource-rich Emerging Markets. For example, approximately 60% of the world’s supply of lithium is found in Latin America (concentrated in Bolivia, Argentina and Chile), according to the United Nations Development Programme—but foreign investment is often needed to mine it.[4]

It's worth noting, though, that the extent of the shift is modest, highlighting that trends in global FDI flows have demonstrated both continuity and change. For example, there has been much discussion of Chinese investment in Africa and Latin America, but levels of such investment remain modest relative to Chinese investment in Advanced Economies. In terms of flows, OECD data show that Korea, Japan, the US and Germany have consistently been the top recipients of Chinese FDI in recent years.[5] ODI Global, using data from UNCTAD, notes that China was the country with the fifth-largest stock of FDI in Africa in 2023 ($42bn)—up from $10bn in 2009, but still far below the Netherlands ($70bn), the UK ($58bn), the US ($56bn) and France ($53bn).[6]

Advanced Economies are still the backbone of global investment flows, but the relative rise of Emerging Markets as recipients—and, critically, sources—of FDI demonstrates the gradual rebalancing of global economic power.

[1] Data sourced from IMF Direct Investment Positions by Counterpart Economy database (formerly the Coordinated Direct Investment Survey (CDIS)). Available at: https://data.imf.org/en/datasets/IMF.STA:DIP Limitations include data quality, coverage, and potential asymmetries. However, it is the only IMF database that includes inward and outward direct investment positions cross classified by immediate counterpart economy. The limitations mean that caution should be used when interpreting the data. For this reason, we categorise the analysis as indicative.

[2] Flow data refer to the value of new investment made during the given time period; stock data refer to the value of all the previous investments, in the aggregate.

[3] There is no precise, standardised definition for these groupings; we have used the IMF’s own country classifications.

[4] https://www.undp.org/latin-america/blog/graph-for-thought/lithium-latin-america-new-quest-el-dorado

[5]https://www.oecd.org/en/data/indicators/outward-fdi-flows-by-partner-country.html?oecdcontrol-ae5a42bdd2-var6=CHN&oecdcontrol-3122613a85-var3=2021

[6] https://odi.org/en/insights/who-holds-the-biggest-foreign-investment-in-africa-not-china/

Anjalika Bardalai photo
Anjalika Bardalai Chief Economist and Director, Economic Research

Anjalika manages TheCityUK’s economic research programme. She leads the team that produces the organisation’s in-house economic research, presents research and analysis externally, and writes TheCityUK’s economics blog.

Prior to joining TheCityUK in 2014, Anjalika spent 12 years with the Economist Intelligence Unit (EIU) in the company’s New York and London offices, holding a number of different roles, including head of the EIU’s flagship Country Reports series. She also worked for the consultancy Eurasia Group, advising financial-markets clients on economic and political risk. She has spoken at conferences in a dozen countries across the Americas, Asia and Europe. In addition, she has appeared as a commentator on leading international broadcast media, and has been quoted in print media in the UK, US, India and elsewhere.

Anjalika has a BA from New York University and an MBA from Imperial College Business School. She sits on the Advisory Council of the International Sustainability Institute, and is an Ambassador for the financial-education charity FairLife. In addition, she is Vice Chair of the RSPCA’s London East Branch and previously served as a Trustee of the charity All Stars London and as a member of the Alumni Advisory Board at Imperial College Business School.