Innovative, AI-based methods of economic analysis can give policymakers unique new insights into economic trends
Rather than a typical economic outlook for the new year, which would have to be highly speculative given the ongoing uncertainty around the Covid-19 pandemic, this first blog post of 2021 focuses on a new economic index that has particular relevance in the Covid era. Indeed, the index highlights a new approach to economic data and economic forecasting itself!
A new economic index addresses some of the deficiencies of traditional data collection
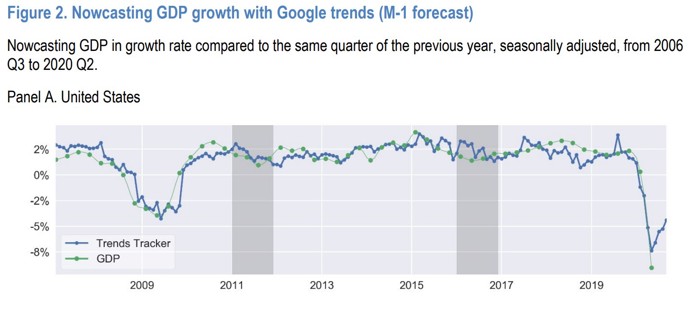
New research by OECD economist Nicolas Woloszko describes a new Tracker that estimates weekly GDP (that is, year-on-year GDP growth, week by week) for 46 countries using Google Trends search data*. Google Trends provides information on the volume and intensity of searches made by Google users; it is a prominent example of high-frequency data which is attracting increasing attention among economists and policymakers for its potential to be used to provide economic analysis that is more detailed than traditional indicators, more timely, or both.
Woloszko’s research used a machine learning algorithm to assess the relationship between Google Trends data and GDP to create the estimates of weekly GDP. The result for the UK is shown below; the chart compares actual GDP growth (the green line) with the Tracker’s simulated forecasts (the blue line; they are simulated because they represent forecasts as if they had been made one month before the official data releases). The close correlation of the two series demonstrates that the predictive accuracy of the Tracker forecasting model is relatively high.
The OECD Weekly Tracker data for all 46 countries are updated regularly, and are available here.
Even before the onset of the pandemic, GDP had attracted growing criticism as an inadequate measure of modern economies. The acknowledged problems with GDP as an economic indicator are many and varied, but one of the key complaints has been that by convention, official GDP statistics are released only quarterly (although the UK recently started producing monthly GDP data), and with a considerable lag—a time frame squarely at odds with today’s demands for more up-to-date economic assessments.
Policymakers can make use of more timely economic data…
The ability to forecast weekly GDP is particularly valuable during a crisis like this pandemic, when the spread of the coronavirus and changes in public-health measures to stem that spread happened so quickly that levels of business activity and household consumption exhibited unprecedented swings in extremely short spans of time. In the words of the paper’s author, the Tracker “provides a useful tool for real-time narrative analysis on a weekly basis”[1]. For example, in the chart below, the bars represent the model estimate of the year-on-year percentage change in GDP for the given week, and show timing detail of the second-quarter collapse in economic activity not captured by the official quarterly or monthly statistics. For example, the data show a fall-off in economic activity beginning the week before the UK introduced its national lockdown on 23 March 2020.
Analysis at this greater level of temporal detail could undoubtedly prove useful for analysis—and therefore be of considerable interest to the economic policymakers who rely on such analysis—even under more normal economic conditions.
…and, crucially, data that can present a more detailed picture of changes in economic activity
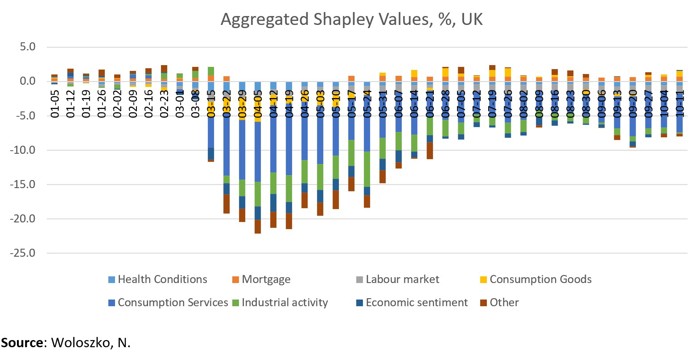
But the new Tracker’s potential value goes far beyond providing more timely estimates. The Tracker is based on Google Trends variables aggregated into groups that make sense in the context of economic analysis (for example, consumption services, or industrial activity). The use of Shapley values[2] permits an analysis of the contribution of the different groups to the GDP growth estimates—in effect, assessing how much different factors contributed to the estimated changes in GDP.
The chart above shows the Shapley decomposition for UK weekly GDP predictions from January-October 2020. Fascinatingly, this provides some insight into what drove the modest economic recovery seen in the third quarter of the year. Most strikingly, the contribution of consumption goods (for example, ‘home appliance’) to growth was positive for most of the July-October period, after having been mostly negative over March-May. The contribution of consumption services (for example, ‘performing arts’), on the other hand, remained negative, although it became steadily less negative from mid-April onwards. The contribution of industrial activity remained negative, but was markedly less negative from late May 2020 onwards.
This type of granular economic insight could prove invaluable to policymakers. The example above is retrospective, but if the prediction model is relatively accurate, then studying the contributions of the various components to estimated GDP growth could give policymakers a new way to analyse economic trends that could allow them to better target policy interventions such as fiscal stimulus measures (to give just one example). This type of analysis also has the advantage of being able to be calibrated—for example, the groups and their component terms could be adjusted to disaggregate economic factors in different ways. (In contrast, traditional analysis of published quarterly GDP data is generally limited to assessing the contributions of broad components: private consumption, government consumption, investment and net exports.)
None of this is to say that traditional methods of economic analysis are becoming obsolete. Innovative, machine learning-based techniques have their own limitations, and there is huge scope for refinement and further study in this area. Nevertheless, an understanding of novel approaches like those presented by the new weekly GDP Tracker, and appreciation of how these can complement traditional metrics, are likely to become indispensable to policymakers as well as economic analysts.
*My thanks to Nicolas Woloszko for reviewing this article before publication, and for sharing the UK data presented here.
[1] Woloszko, N. (2020), ‘Tracking activity in real time with Google Trends’, OECD Economics Department Working Papers, No. 1634, OECD Publishing, Paris, https://doi.org/10.1787/6b9c7518-en
[2] Originally used in game theory, Shapley values are used to assess the average marginal contribution of each player in a co-operative game to the collective gain of that game, to allow a fair distribution of gains to the players. A simplified explanation of their machine learning application is that Shapley values are a way to explain an algorithmic prediction by measuring the contributions of the component parts of the prediction to the overall prediction.
