Read the speech given by Anjalika at the CISI UK-China Finance Development Forum.
Good morning, good afternoon everyone, depending on where in the world you are. Thank you very much to George for the introduction, and for the invitation to address such a distinguished audience on such an important topic. The idea of today’s forum is to provide insights into how we promote green development. TheCityUK’s economic research in this area has focused on how finance, industry and government can work together to ensure as much real-economy impact on sustainability as possible. So I’d like to share with you some insights from our recent research, which is quite unique in its attempt to quantify green finance over the past decade, covering the years 2012-21.
Before I share some of the detail, let me explain some of the key messages from our research.
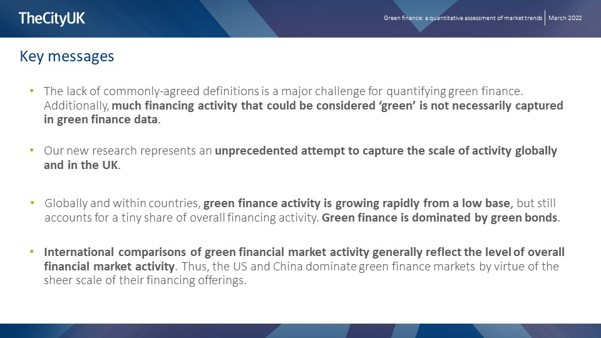
First is an important point about green finance data generally. Our new research actually represents an attempt to do something that’s extremely difficult, if not impossible, to do. That’s because there aren’t any standardised definitions of green which allow for ‘hard’ quantification of green finance. That means our analysis is indicative - but it’s an important attempt to assess the state of green finance in an objective way.
The headline finding isn’t surprising – green finance has grown very rapidly, from a low base. But we do need to keep this growth in context; it still represents less than 5% of total finance.
And finally, international comparisons of green financial market activity generally reflect the level of overall financial market activity. So, the US and China dominate green finance markets by virtue of the sheer scale of their finance offerings.
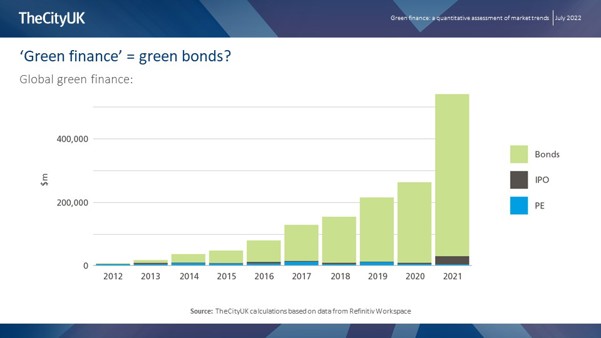
This is an important chart because in a way it summarises the key points of the research.
You can see three things here.
First, that green finance has grown steadily and significantly over the past decade, from a very low base.
The second thing you can see at a glance here is the scope of our analysis; we included green bonds, green IPOs and green private equity.
And the third thing that’s obvious from this chart is that green finance is almost completely dominated by green bonds – cumulatively over the 10 years, they account for more than 90% of total green finance using our definition.
When we looked at green bond issuance in a little more detail, we recognised that green bonds have only existed since 2007 and in the early years, issuance was undertaken almost exclusively by supranationals and sovereigns, and it’s only really in the past 6-7 years that private-sector issuance has taken off. And although we found that even though both private and public sector green bond issuance surged in 2021, overall, the market has been driven by sovereign and supranational issuance.
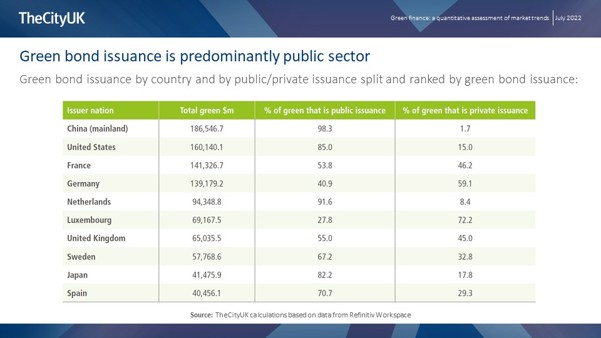
This table lists the largest green bond markets in absolute terms, and then gives the split between public and private issuance in each of those markets.
And you can see that with the sole exception of Luxembourg, public issuance accounted for more than half of total issuance in every single major market. In the UK, private sector issuance was just under half of the total, and in China, it was negligible.
I’m not going to take you through our analysis of global trends in loans and equities because I want to spend a bit of time looking at some of the UK data. But before I do that I’ll just share a little bit of the work we did on international comparisons.
As I mentioned in my introduction, we found that green finance markets are highly correlated with overall financial markets, which tend to be correlated with the size of countries’ economies. So it’s completely logical that when you look at green finance markets in terms of absolute size, the US and China tend to dominate by huge margins. But because that doesn’t necessarily give us insight about green finance markets per se, we dug deeper and used a second methodology to analyse markets in relative terms.
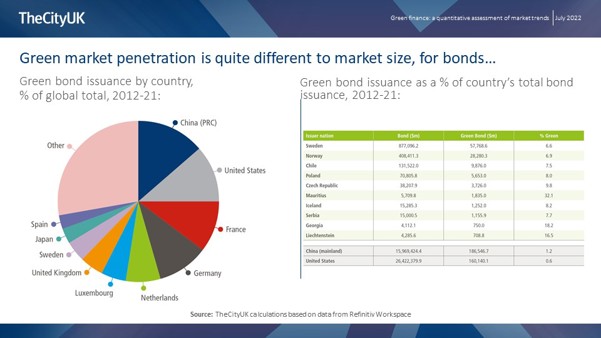
And you can see the results for green bonds here, with the results in absolute terms in the pie chart, and the results in relative terms in the table. The table lists the countries that had the highest percentage of green bonds relative to total bonds, which is what I termed green bond penetration, and presents them in descending order of the value of green bond issuance.
And that presentation is because mathematically, this relative approach favours smaller markets—And you can see that we’ve included the US and China at the bottom of the table as well, purely to give a sense of the scale differences.
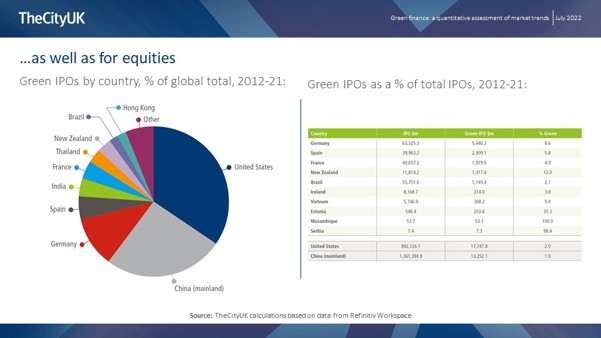
These trends are even more pronounced looking at equity markets.
Here you can see that the US, China and Germany dominated green IPO activity, accounting for around three quarters of total global green IPOs over the decade. Germany actually stands out on a relative basis as well.
So coming now to look at the UK, and the particular role that London, as one of the world’ leading IFCs, might play in supporting a global green economy.
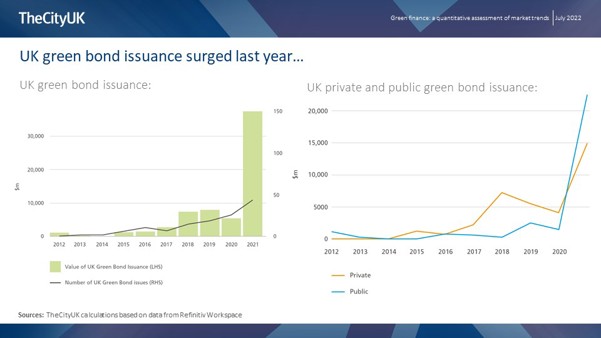
Here you can see that UK green bond issuance grew from $1.1bn in 2012 to $37.4bn in 2021; cumulative issuance over the ten years was $65bn. And the number of UK green bond issues has also increased during the past decade.
And on the right you can see the detail for the UK of the trend I mentioned earlier – green bond issuance really took off just since 2020, and in the UK in fact the recent increase was really driven by the two green sovereign bond issues of autumn last year. These alone accounted for fully one-third of the UK’s total green bond issuance over the 10-year period. The other 42 UK public sector green bonds were issued by the European Bank for Reconstruction and Development – the way the data was categorised, supranationals were included with sovereigns, and the EBRD is headquartered in London so its bonds were attributed to the UK. In the first three years we considered, this category of “agency, supranational and sovereign” entities were in fact the only issuer of green bonds in the UK.
The first issuance of a private green bond was in 2015. But corporate issuers then dominated from 2015 until 2021, when we had the sovereign issues. In total, the private sector issued 89 green bonds over the decade, the largest of which was Vodafone’s $3bn issue in 2019.
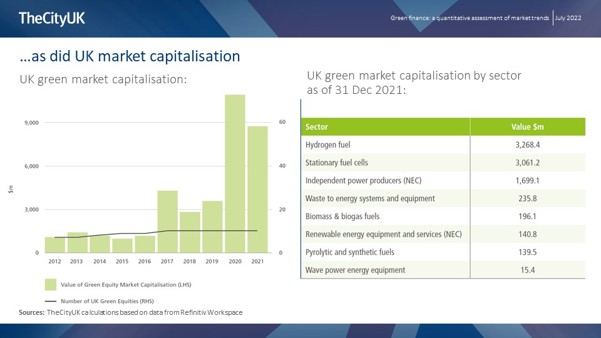
On the equity side, we looked at market capitalisation as an indicative metric, because of course market cap only gives you a snapshot of valuations at a point in time, and although we found that green market cap surged in 2020 and 2021, it’s pretty obvious that many factors besides the inherent value of green companies could have affected the share prices of those companies in those years.
Since market cap is just an indicative measure, we considered green IPOs, because IPOs are actually a form of capital raising. What we found is that green IPO activity in the UK is still quite limited, with a cumulative sum of $538m over the past decade and a maximum in a single year, in 2013, of around $400m. The UK only witnessed green IPO activity in 2013, 2014, and 2018, and 2021.
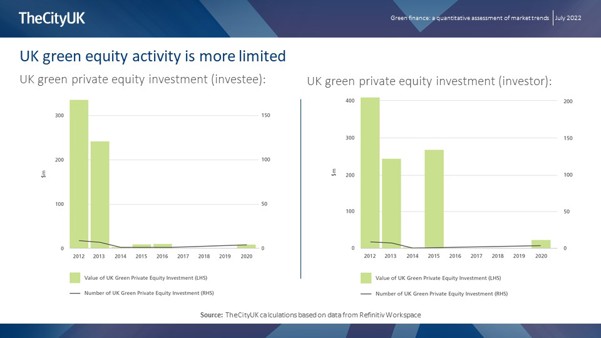
On the private equity side, though, we see here on the left details of green PE investment into the UK, and on the right you see green PE investment where the investors were UK based. You can see that activity was concentrated in just a few years over the decade. A deeper analysis of the data revealed, interestingly, that UK investors have mainly channelled their private equity investments to UK businesses in most years. For example in 2012, which as you can see was a standout year, UK investors invested around $400m in the green private equity market, of which 80% went to UK-based private businesses.
So that’s all the data I plan to show you, but I also wanted to share with you this graphic, which is from research by the City of London Corporation which we used in our own report because it highlights the role of the wider ecosystem.
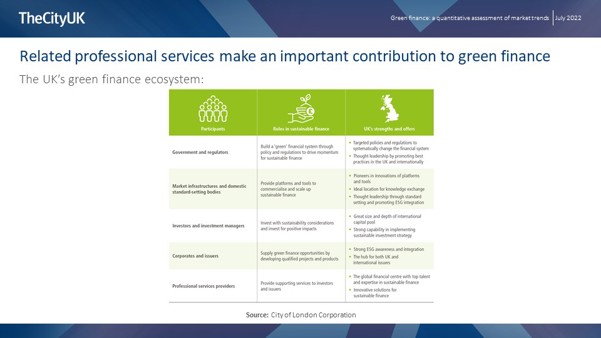
Our report focused on green finance but the related professional services of legal, accounting and consulting complete the ecosystem and contribute to the UK’s role as a green finance centre.
There is of course a lot more detail in our research but I think those are some of the points that are most fitting for today’s event. I’ll leave you with conclusions on this slide:

The first two points are the ones I made in my introduction, which are also fitting for a conclusion.
And I think there’s an interesting question that follows on from this, which is around how much weight we should attach to these measures of what is ‘green’ or ‘not green’. We should keep in mind that the question we’re actually trying to address is whether the projects that will help us attain net-zero outcomes are receiving the requisite financing, and whether the financial services sector is facilitating that, bearing in mind that a lot of environmentally-friendly projects are being financed in ways that are not officially labelled ‘green’. In short, this is about the ends vs the means.
And the last two points summarise my broad view of green finance competitiveness.
So let me end there, and thank you once again for the opportunity to contribute to this crucial discussion.

