Different measures of productivity tell different stories
In our new research in partnership with PwC, ‘No time to lose: reasserting UK leadership in financial and related professional services’, one of the many indicators considered was financial and related professional services productivity. The research noted that financial services productivity (measured by real output per employee) is around 2.5 times higher than productivity in the UK economy as a whole.
This differential is also highlighted in our annual Key facts about UK-based financial and related professional services research, albeit using a different measure of productivity. We noted that “Output per hour for the financial services sector was £104.1 in 2023, compared with whole-economy productivity of £39.3. On this metric, the sector ranks third, behind mining and quarrying (£269.3), and electricity and gas (£136.9).” That strong performance relative to other sectors of the economy can be seen here:
UK nominal output per hour by sector, £, 2023
Source: Office for National Statistics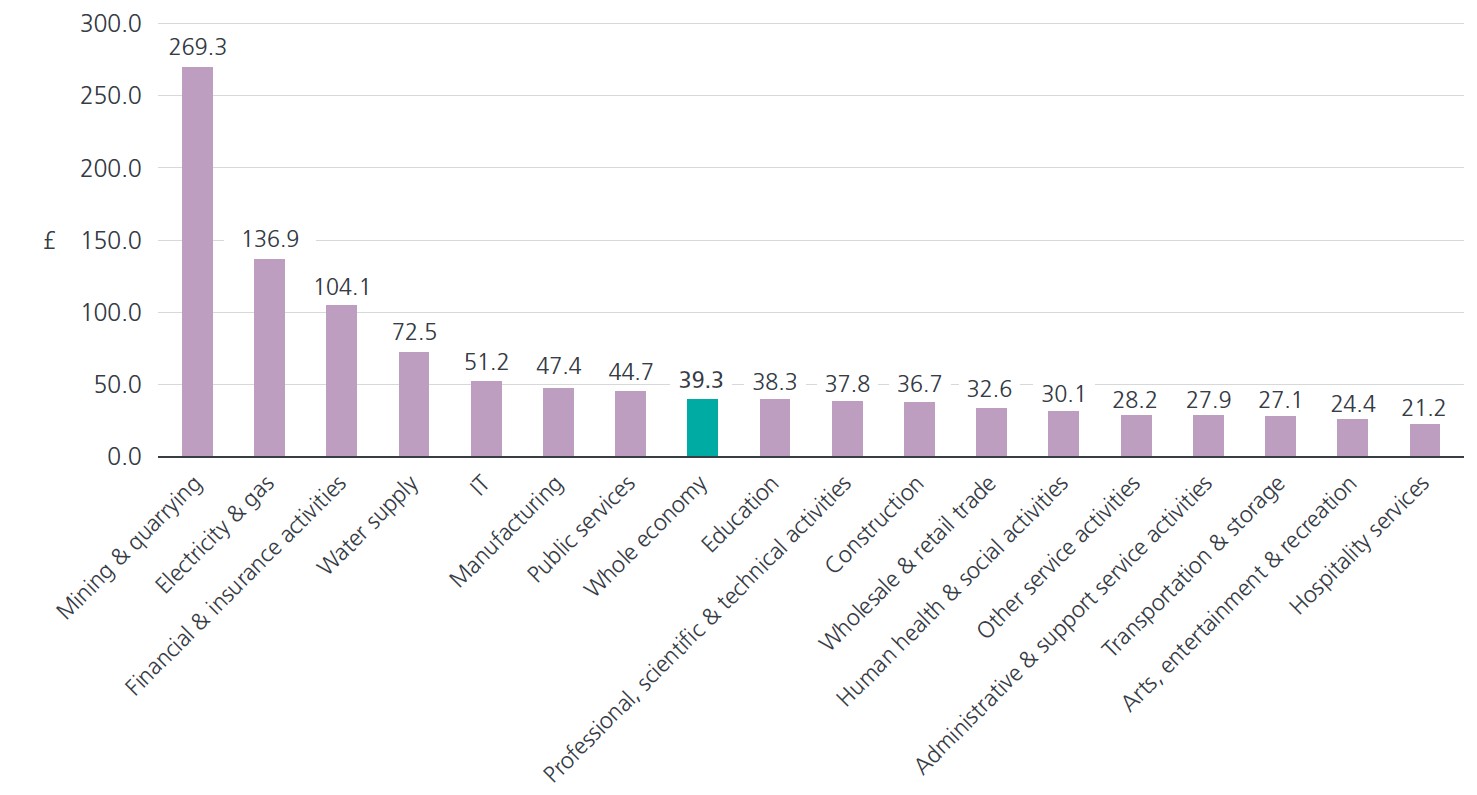
*The ONS suppressed data for Agriculture forestry and fishing, and Real estate due to volatility and low response rates.
Financial services maintains higher productivity than the wider economy, but the gap has been narrowing
However, our new research in partnership with PwC makes the point that the multiple has been declining in recent years. Although financial services productivity is still much higher than productivity in most other sectors, the gap between the two has been shrinking, as this analysis from PwC shows:
GVA per employee - UK financial services vs. whole economy, £k per employee (real), 2008 - 2024
Source: Office for National Statistics, Nomis, PwC Strategy& Analysis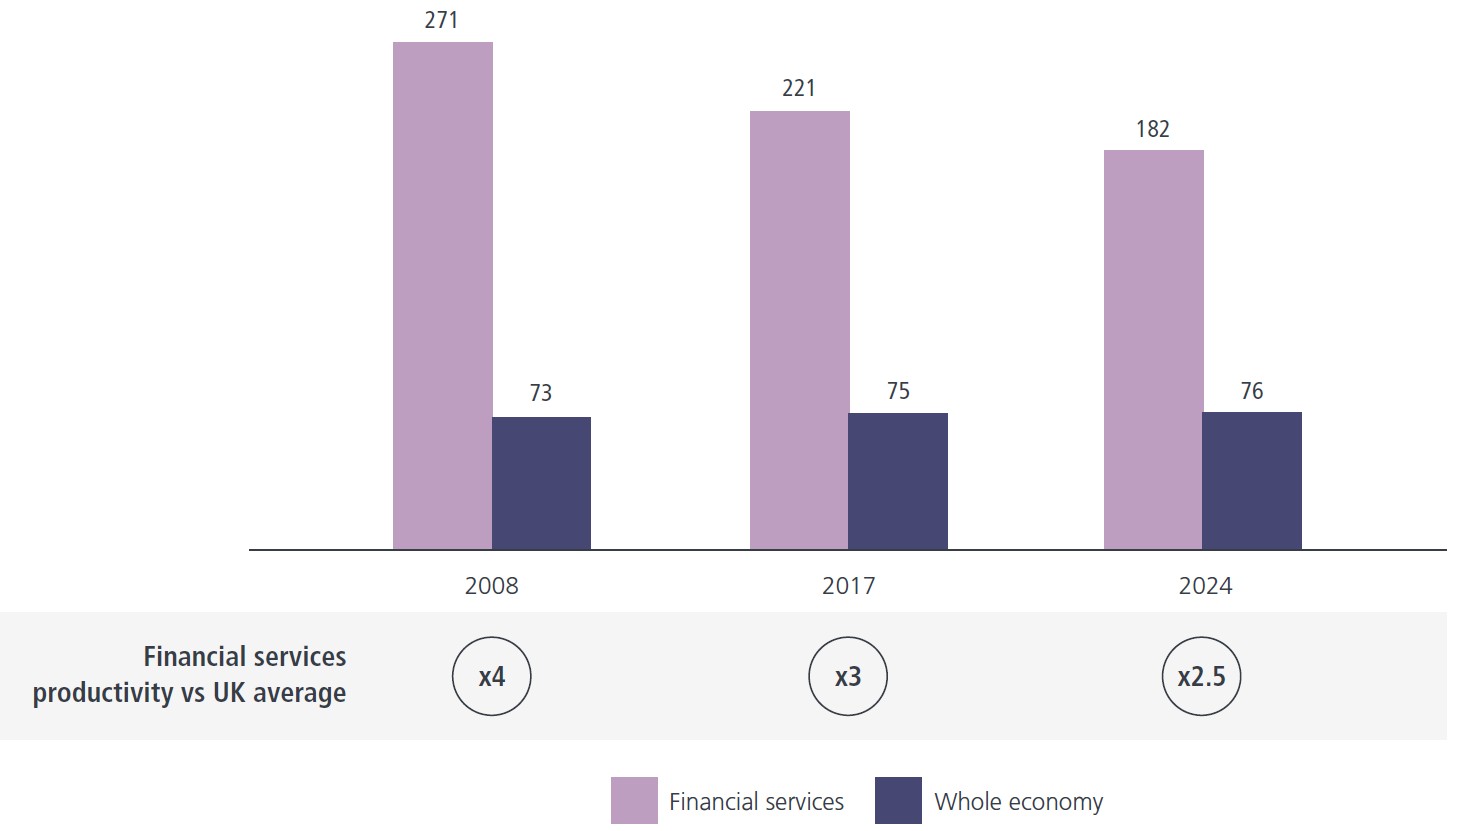
Note: Analysis performed on Financial Services only (i.e. GVA and employment data along SIC classifications 64, 65, and 66). Related Professional Services are excluded from this analysis.
The report notes that “The productivity challenge appears to be broad based across many sub-sectors. Since 2019, cost-to-asset ratios at the largest UK banks have been flat, expense ratios at UK insurers have deteriorated slightly, with the exception of Lloyd’s and the London Market, and average revenue per employee remained flat across the Big Four accounting firms.”
Our analysis shows that the narrowing differential described above has been driven by a decline in real-terms productivity in financial services as well as an increase in real-terms productivity in the wider economy, as can be seen in the chart below:
Real Output per Employee, 2009–2023 (Index: 2023=100)
Source: TheCityUK calculations based on Office for National Statistics data for GVA and Nomis data for employment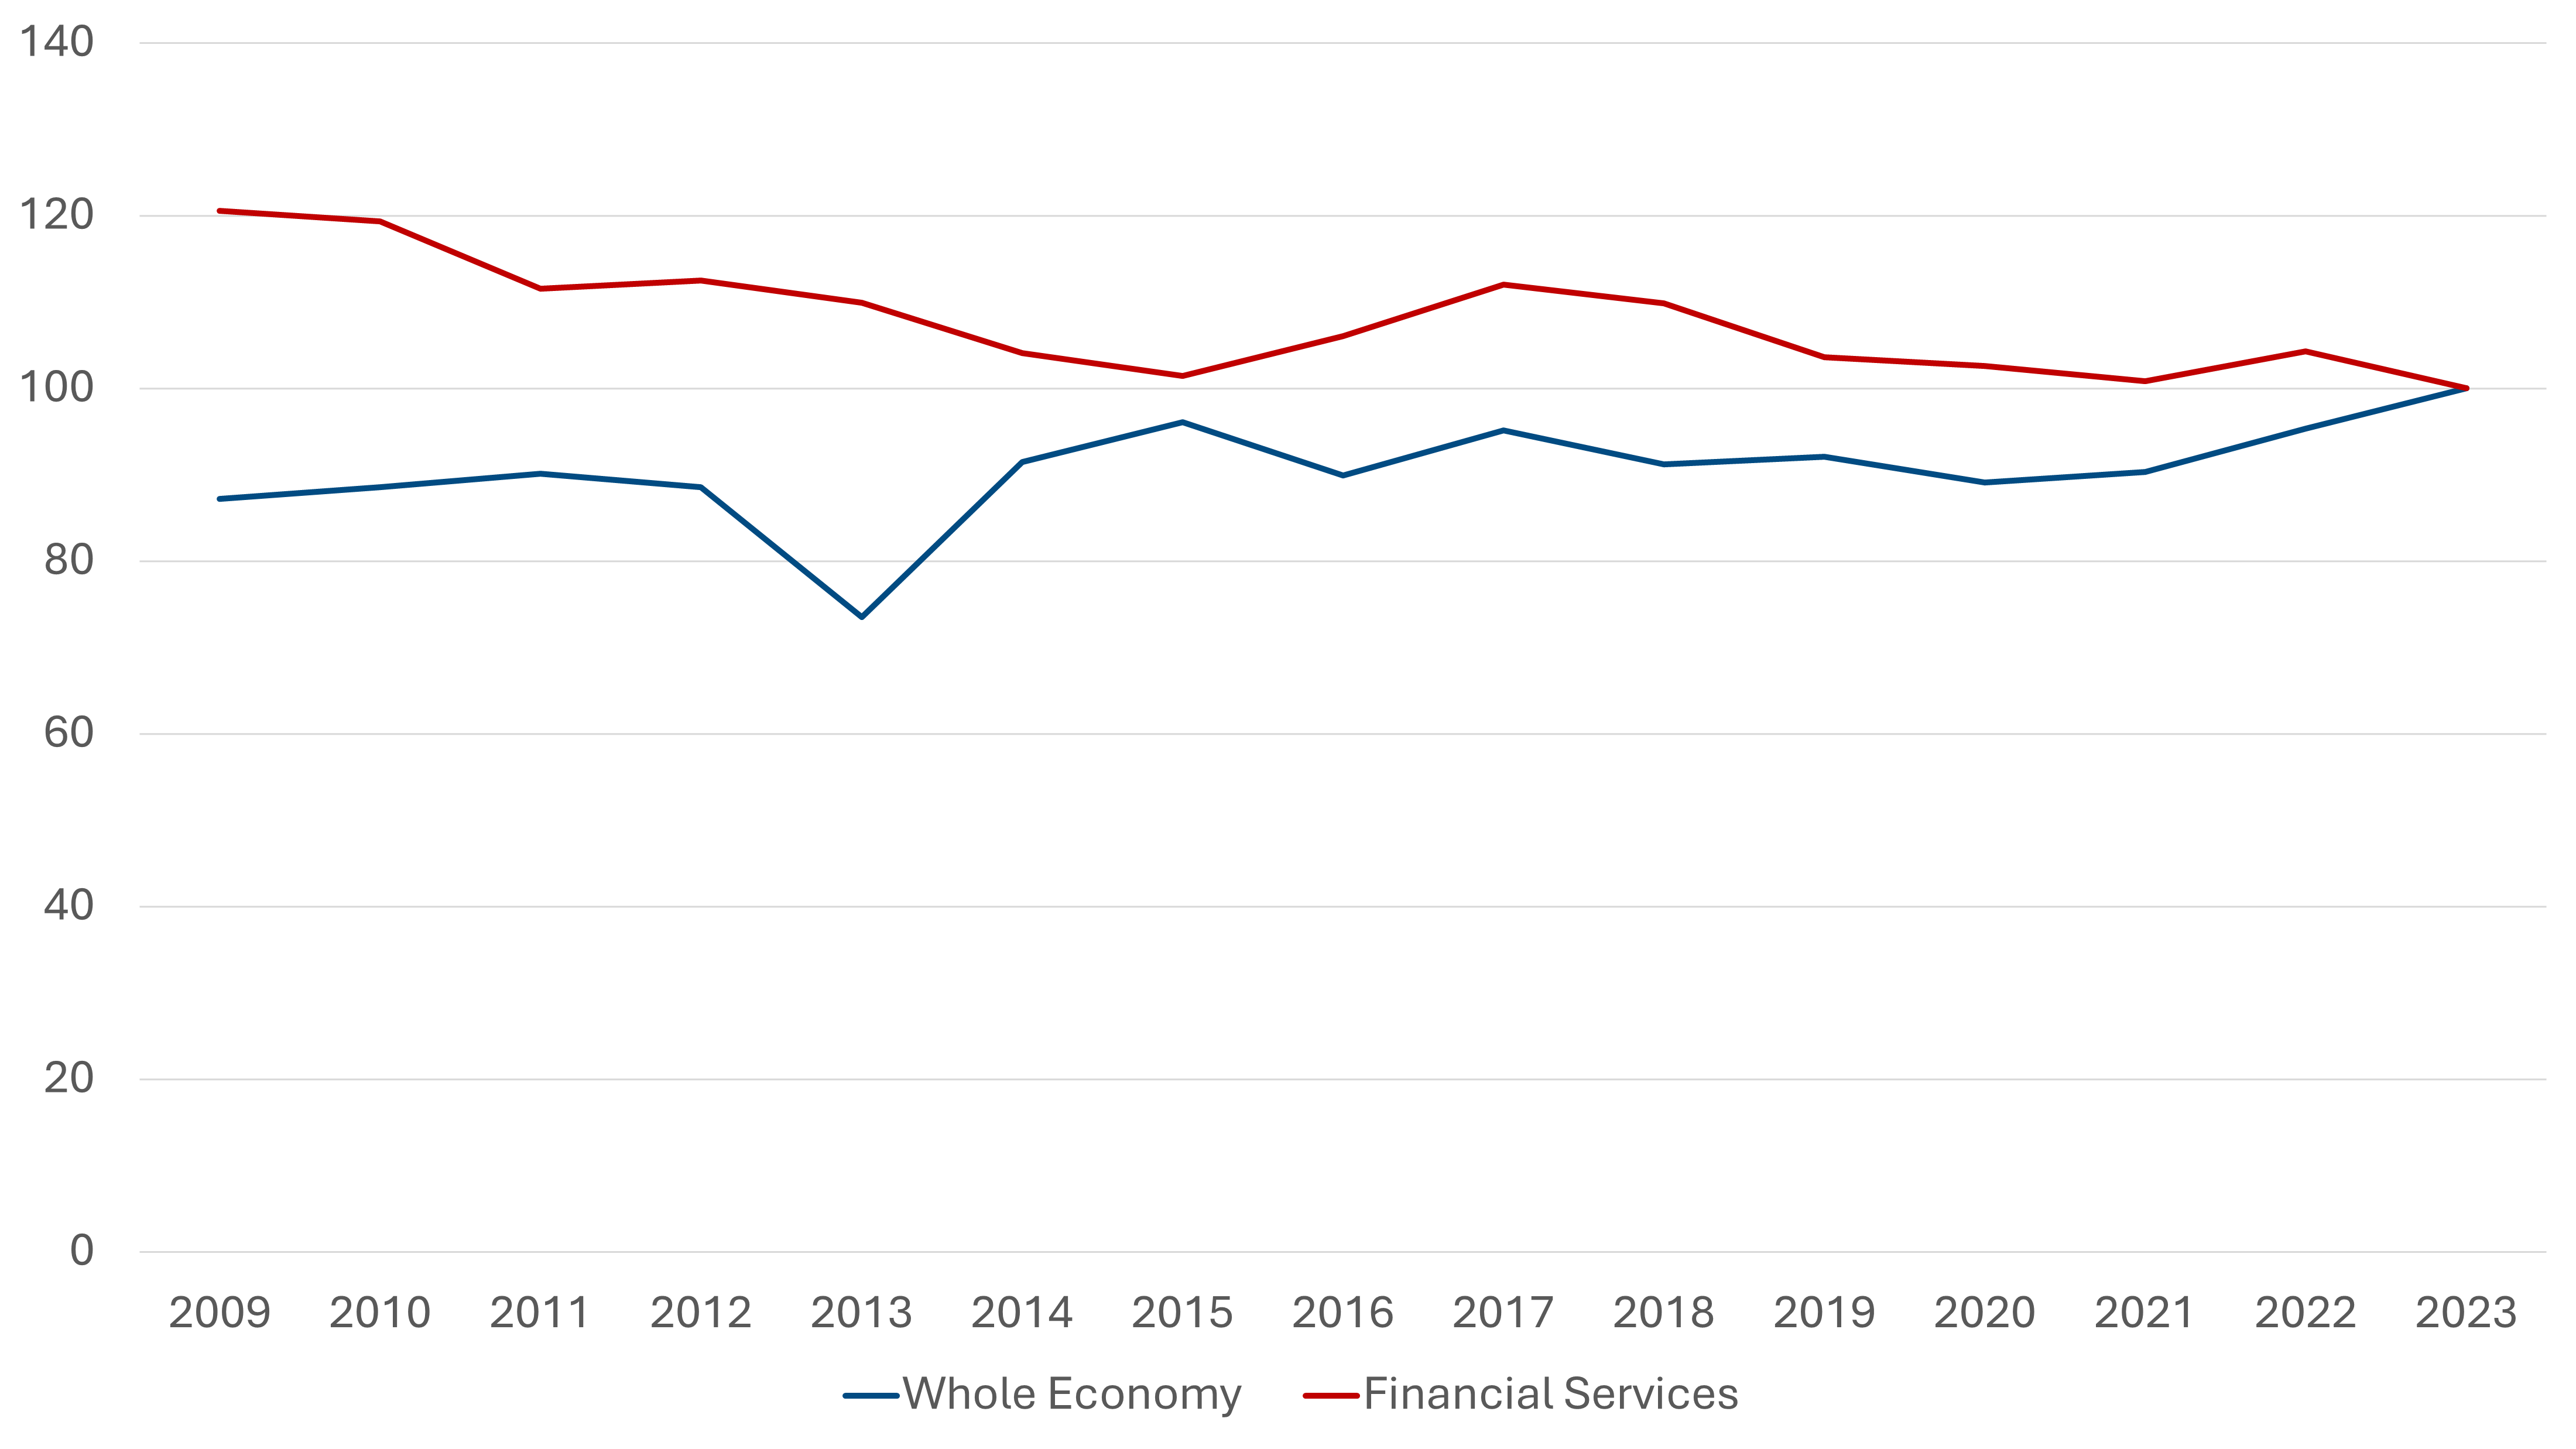
The chart below offers another perspective on the same trend. Looking at a different measure – output per job, we can see that in 12 out of the 17 years since 2007, financial services has made a negative contribution to overall productivity growth. This implies that overall productivity growth has generally been driven by other sectors.
Financial services contribution to year on year growth in output per job growth, 1998-2024 (percentage points)
Source: Office for National Statistics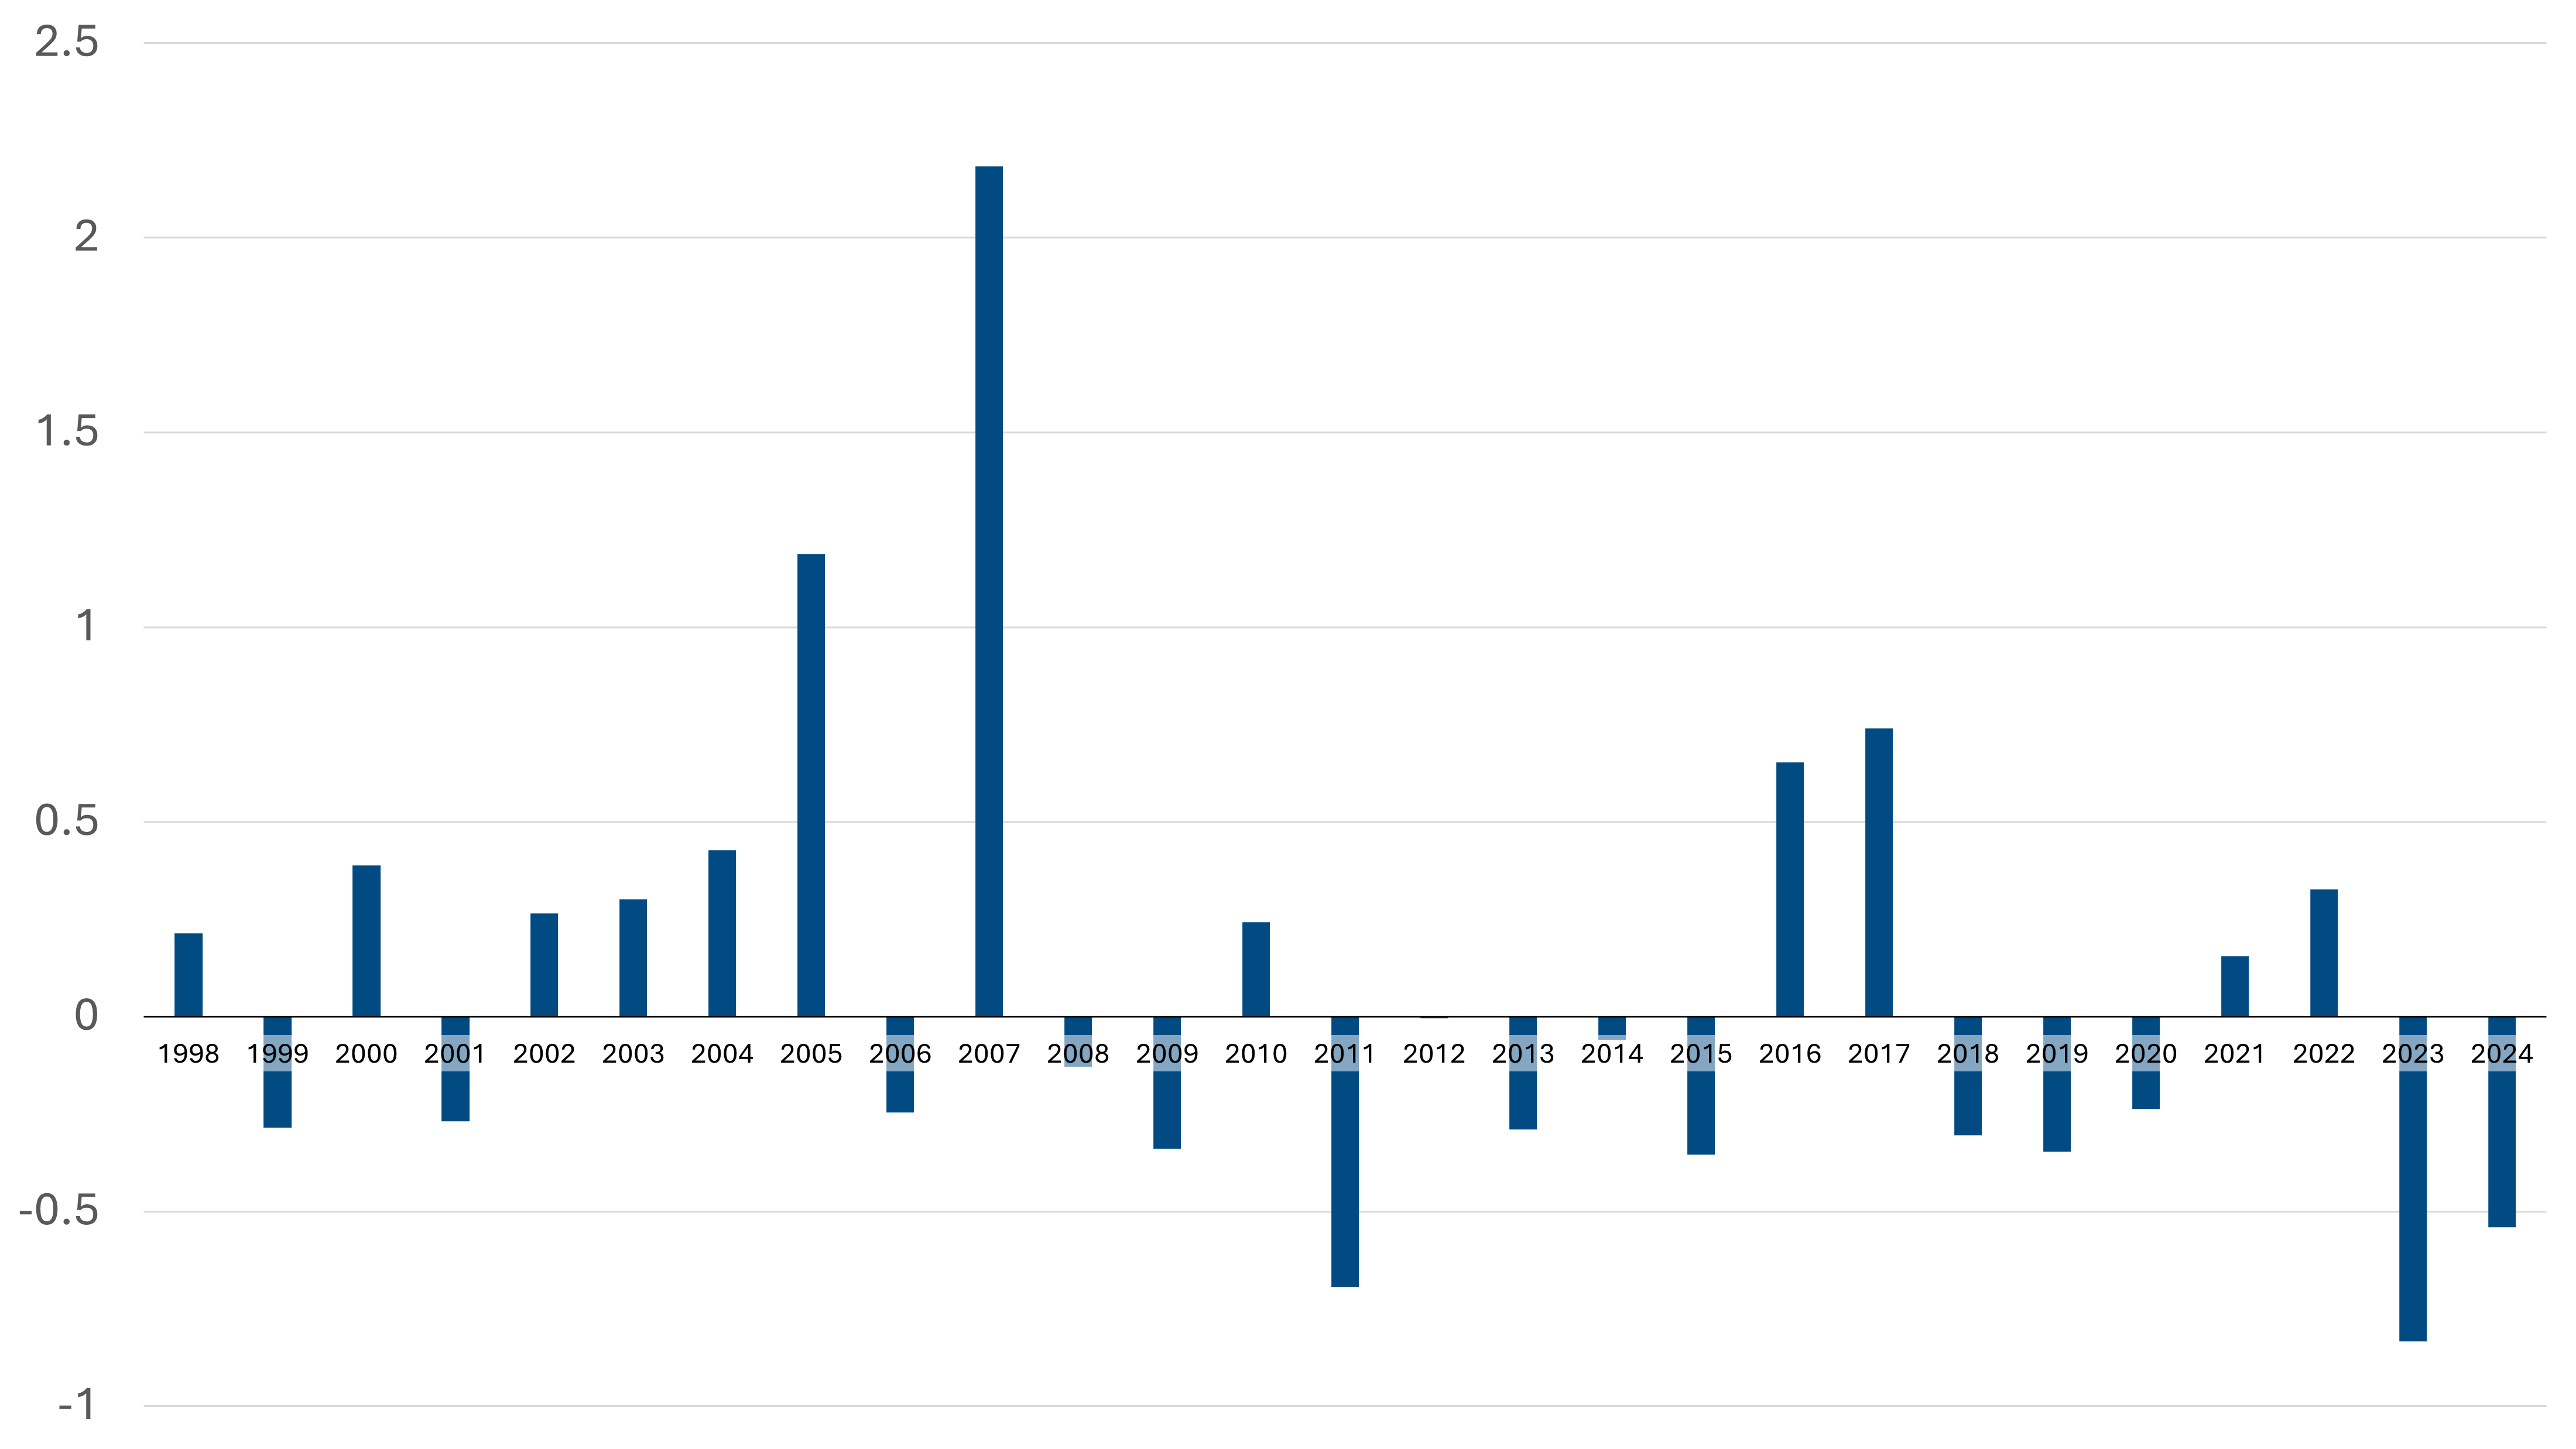
Different productivity measures can tell different stories
Thus far, this blog post has referenced three different measures of productivity: output per hour, output per job, and output per employee. All three measures are used in various official datasets, demonstrating how inexact a science measuring productivity is. To look at this in more detail, we compared output per job and output per employee measures of productivity. For financial services, the trends in the two measures were identical:
Financial Services Productivity: Employee‑Based vs Job‑Based Measures, 2009-2023 (Index: 2023=100)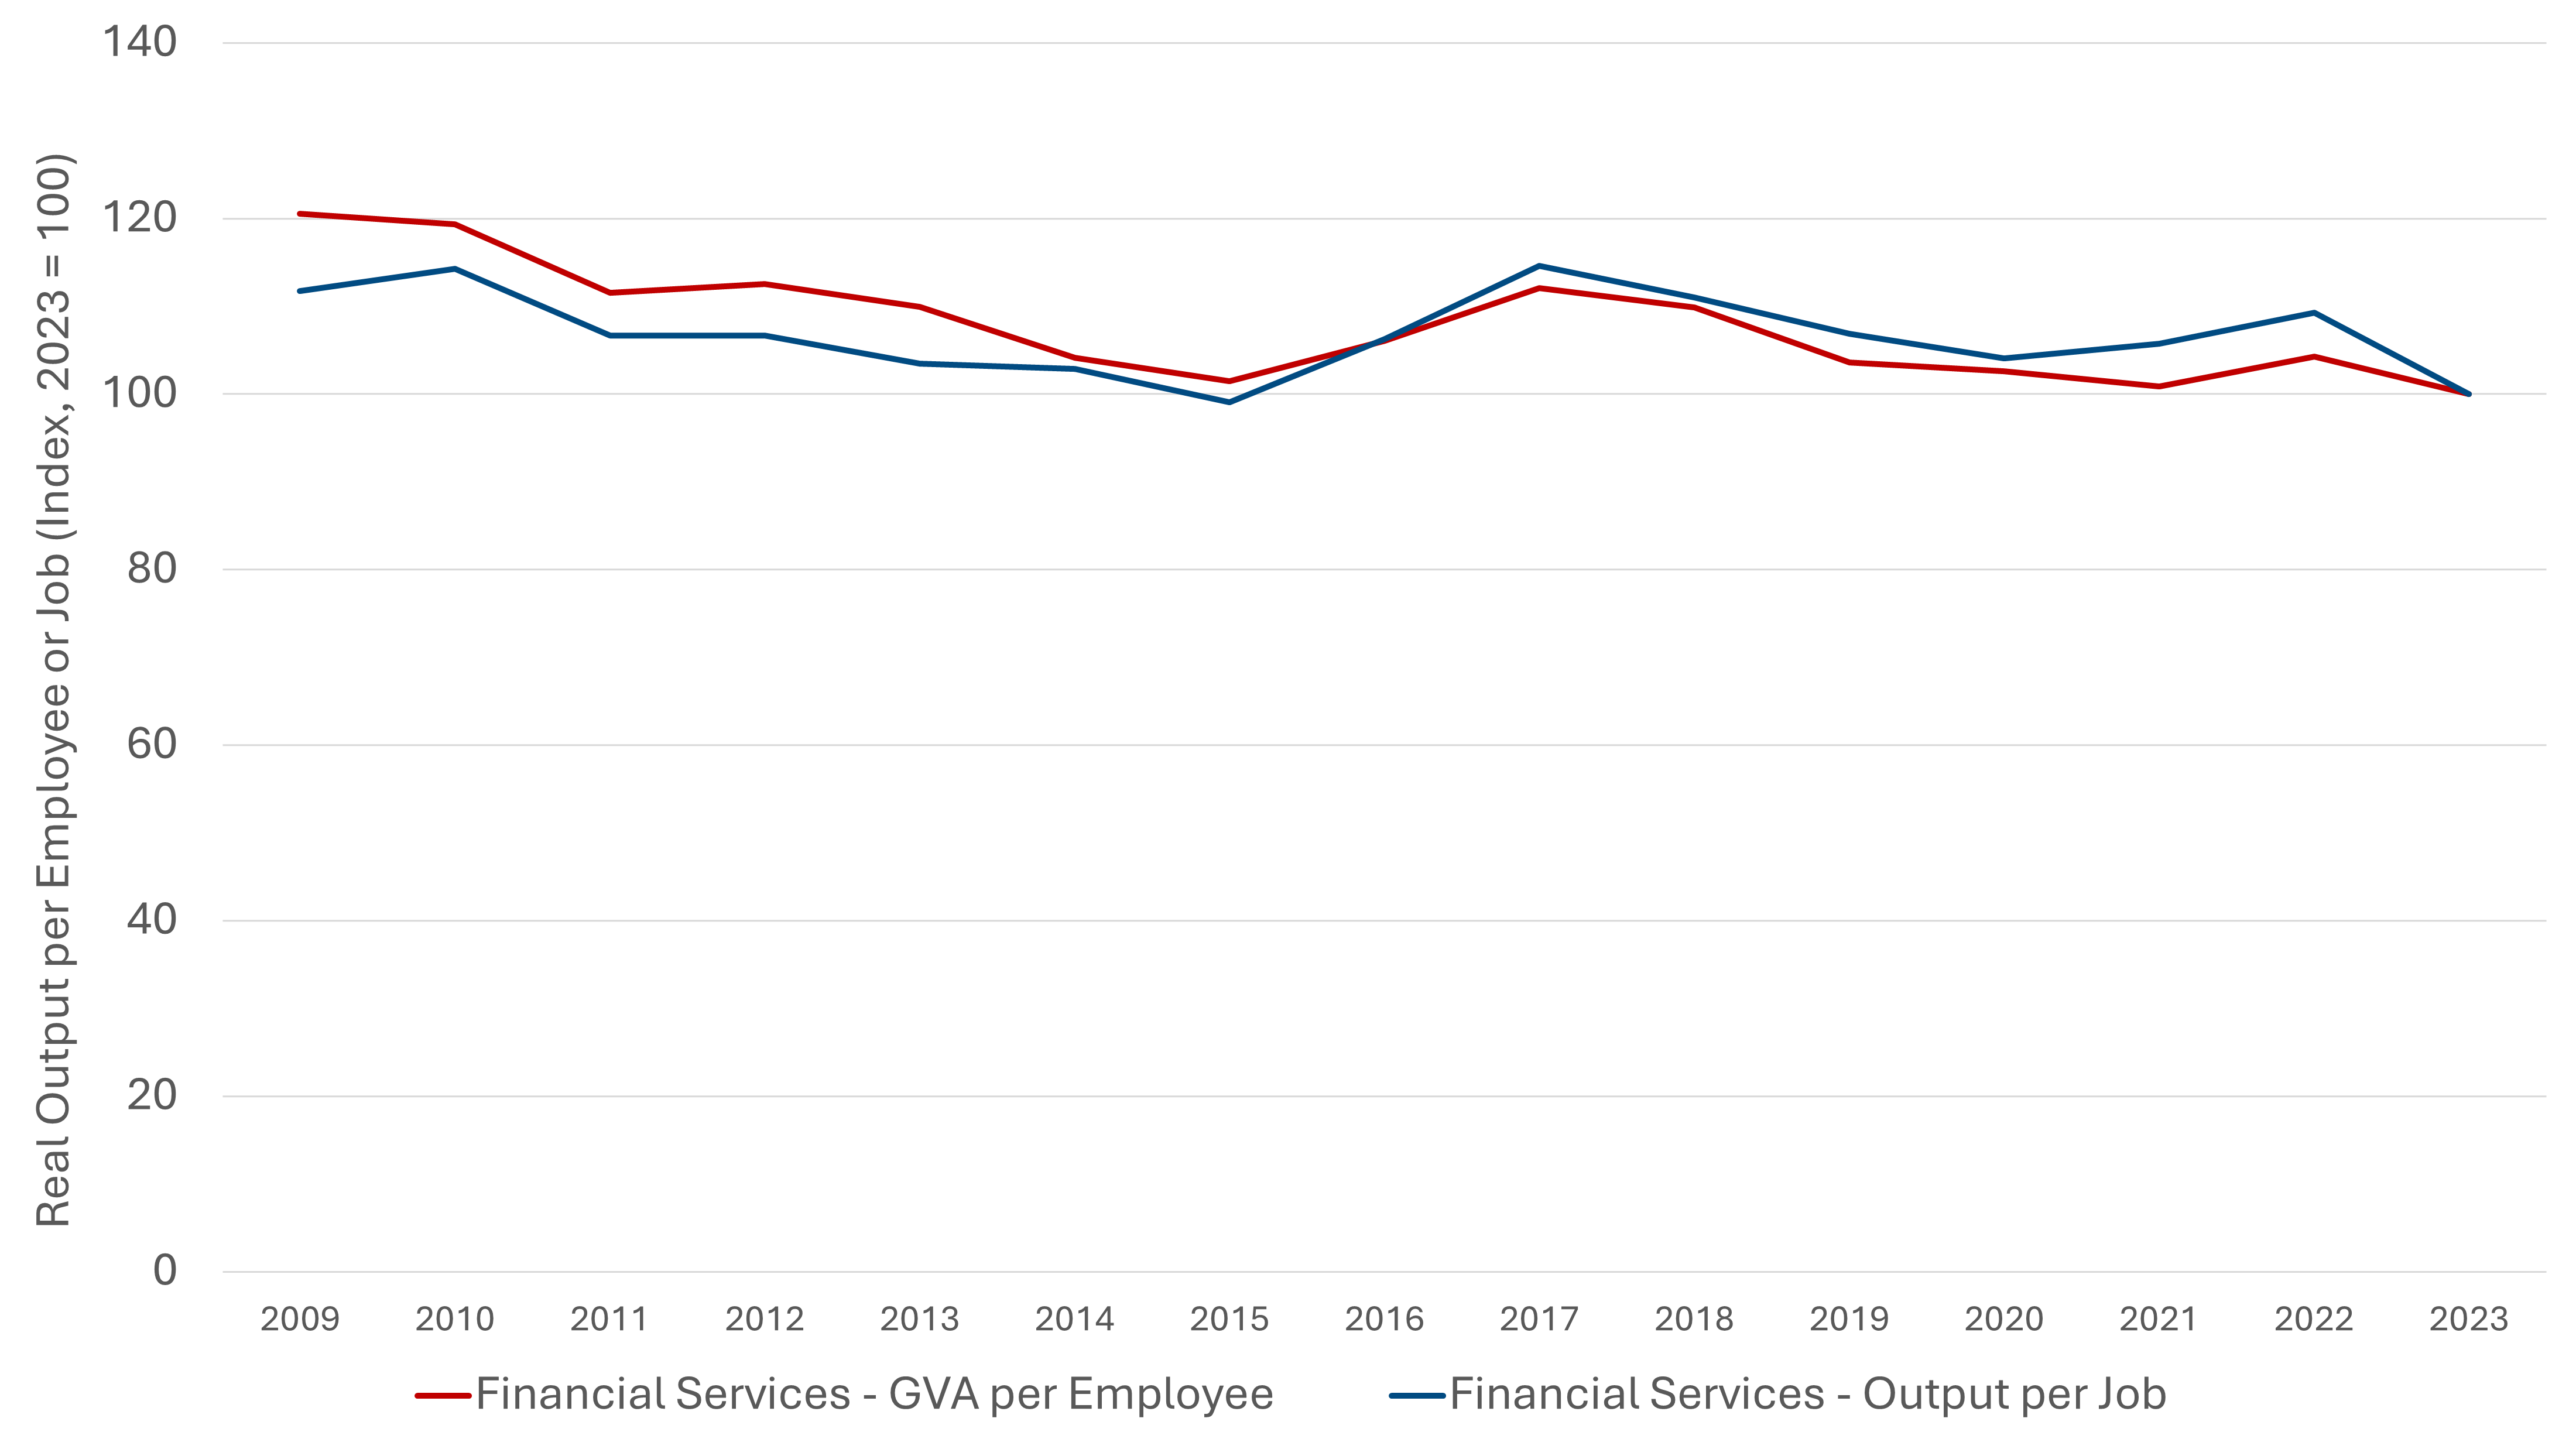
For the wider economy, though, the two measures diverged, as can be seen here:
Financial Services Productivity: Employee‑Based vs Job‑Based Measures, 2009-2023 (Index: 2023=100)
Source: TheCityUK analysis based on Office for National Statistics and Nomis data.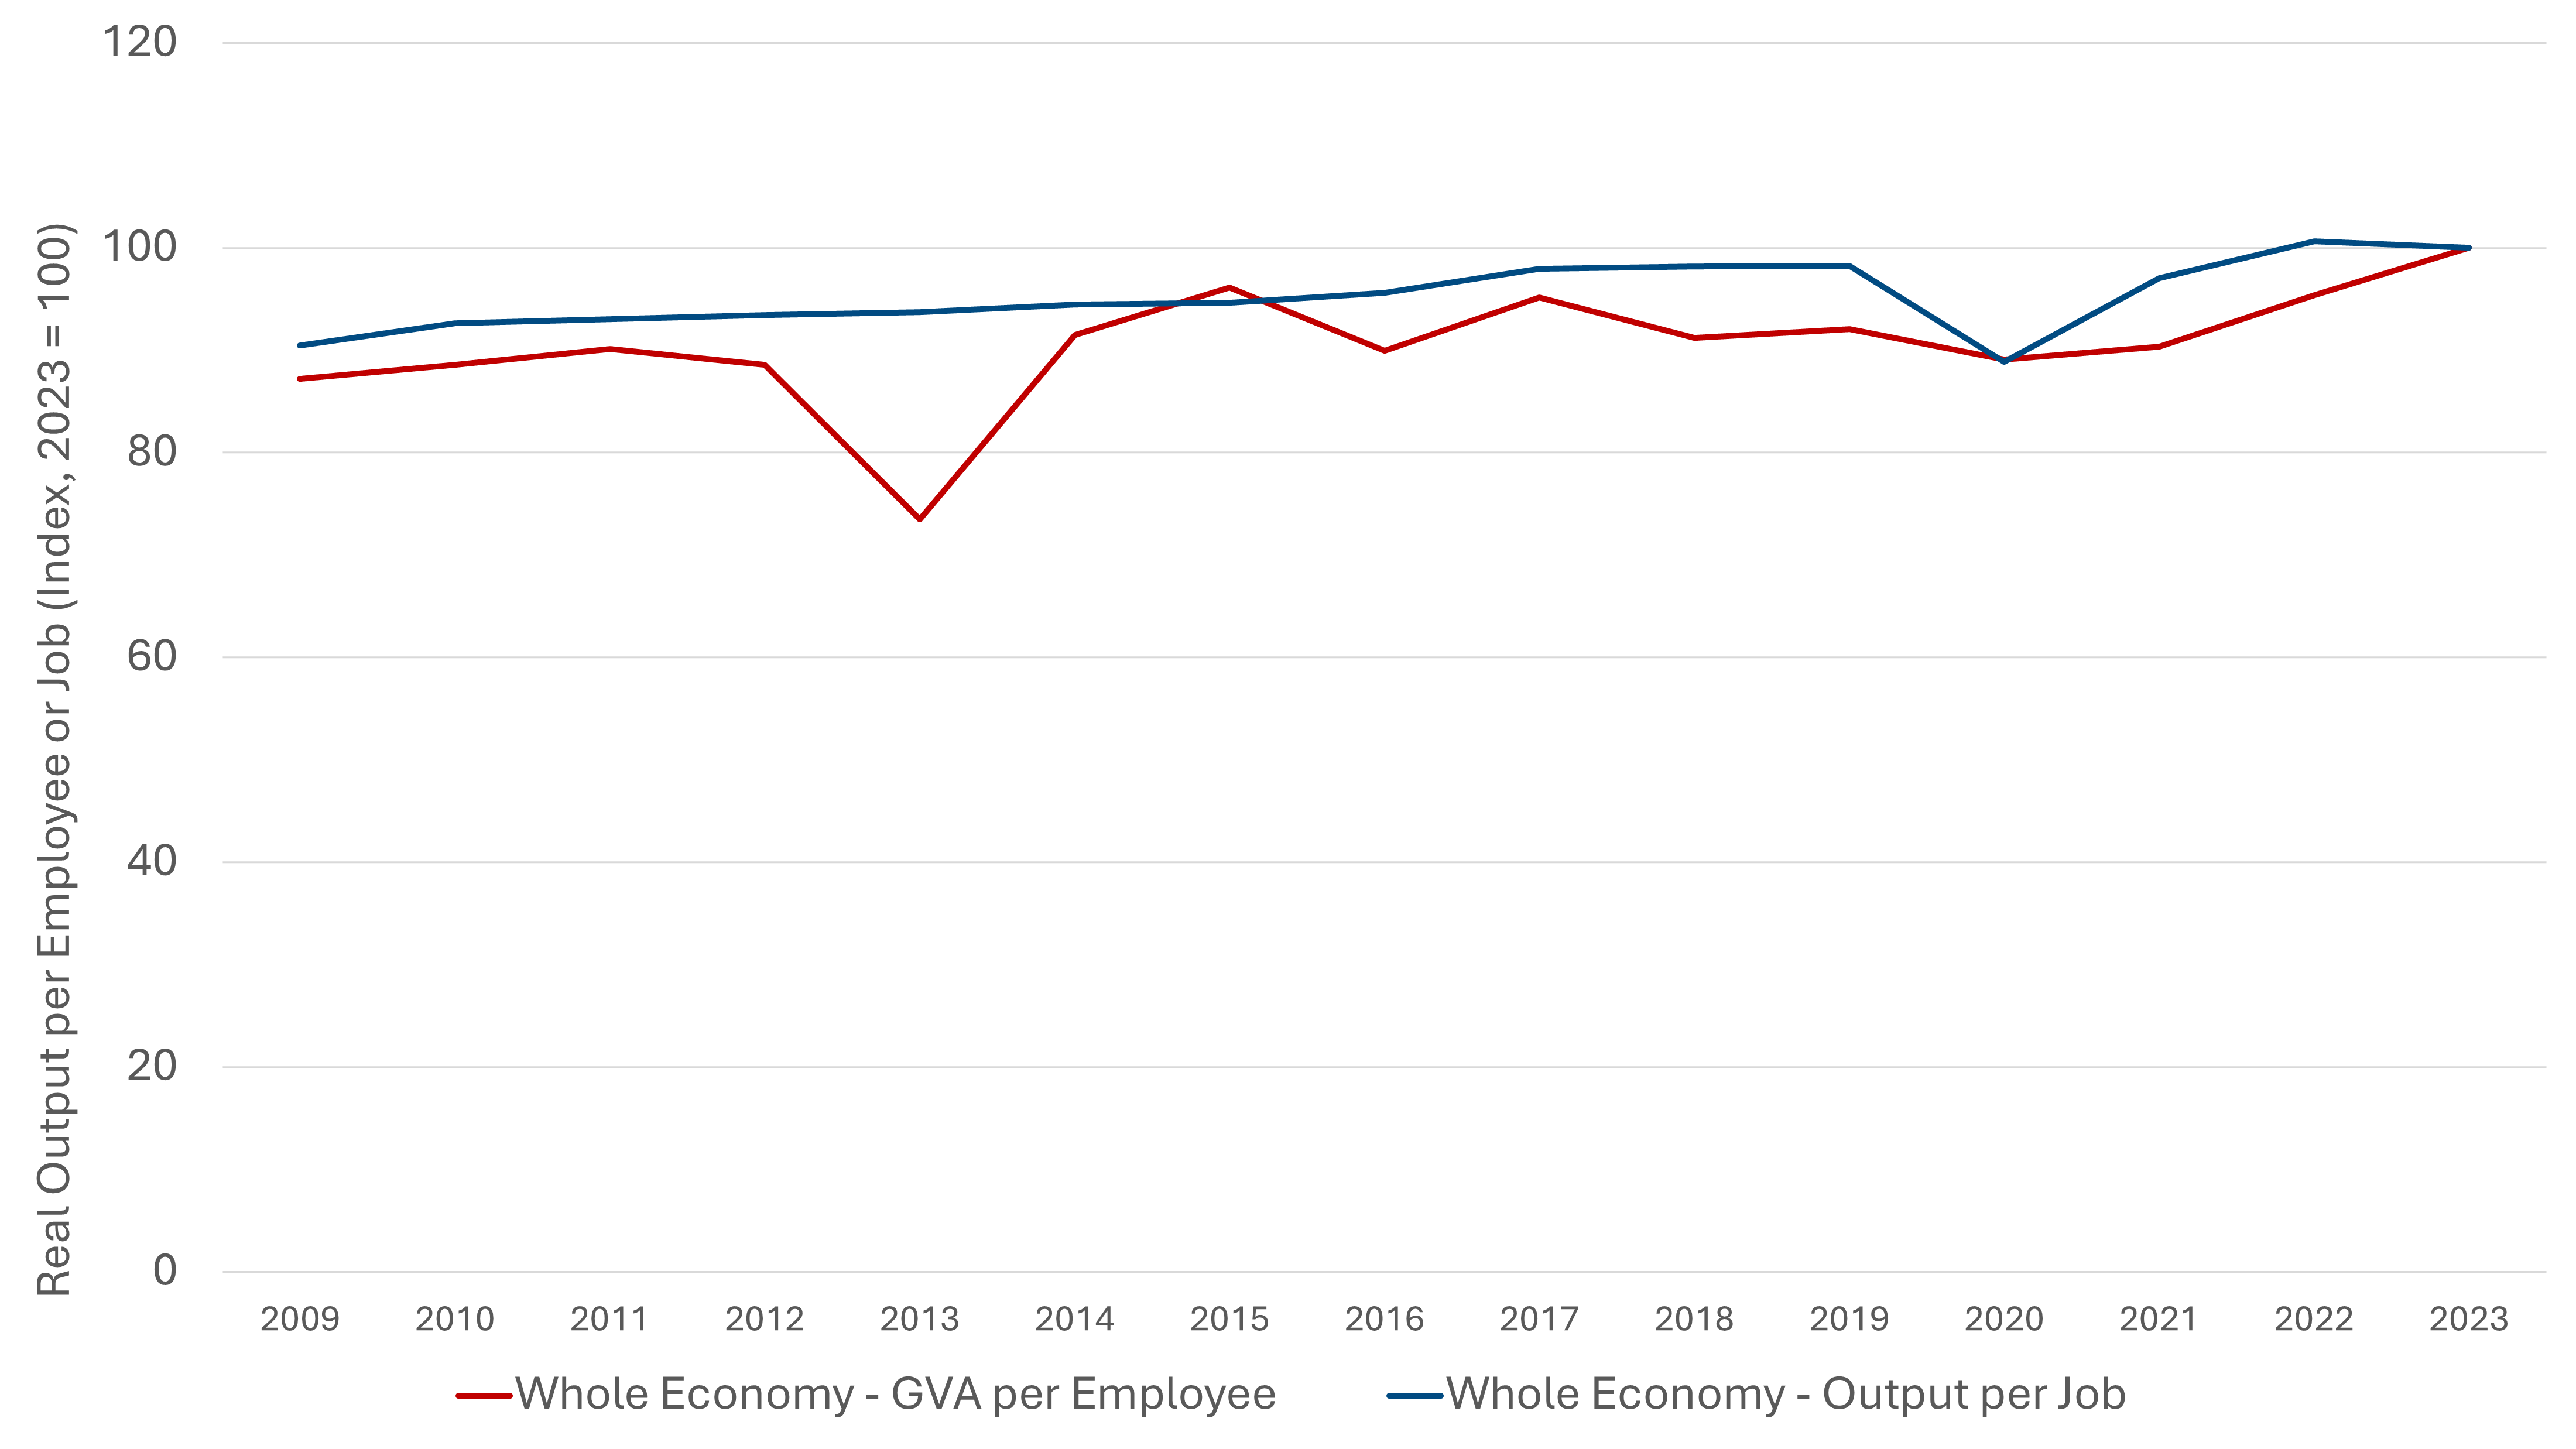 Output per job is a broader measure of productivity because it includes self-employment and trainee jobs in addition to formal employment. So, one possible reason for the diverging trends shown above is that the number of jobs has grown faster than the level of employment. This is also consistent with the fact that the divergence is not really evidence in financial services, because financial services generally makes less use of non-formal employment such as ‘gig-economy’ roles that see individuals holding multiple positions.
The decline in related professional services productivity has been less marked
Finally, we used official employment data to estimate productivity for related professional services, and compared it to financial services:
Financial Services and Related Professional Services,
real output per employee, 2009–2023 (Index: 2023 = 100)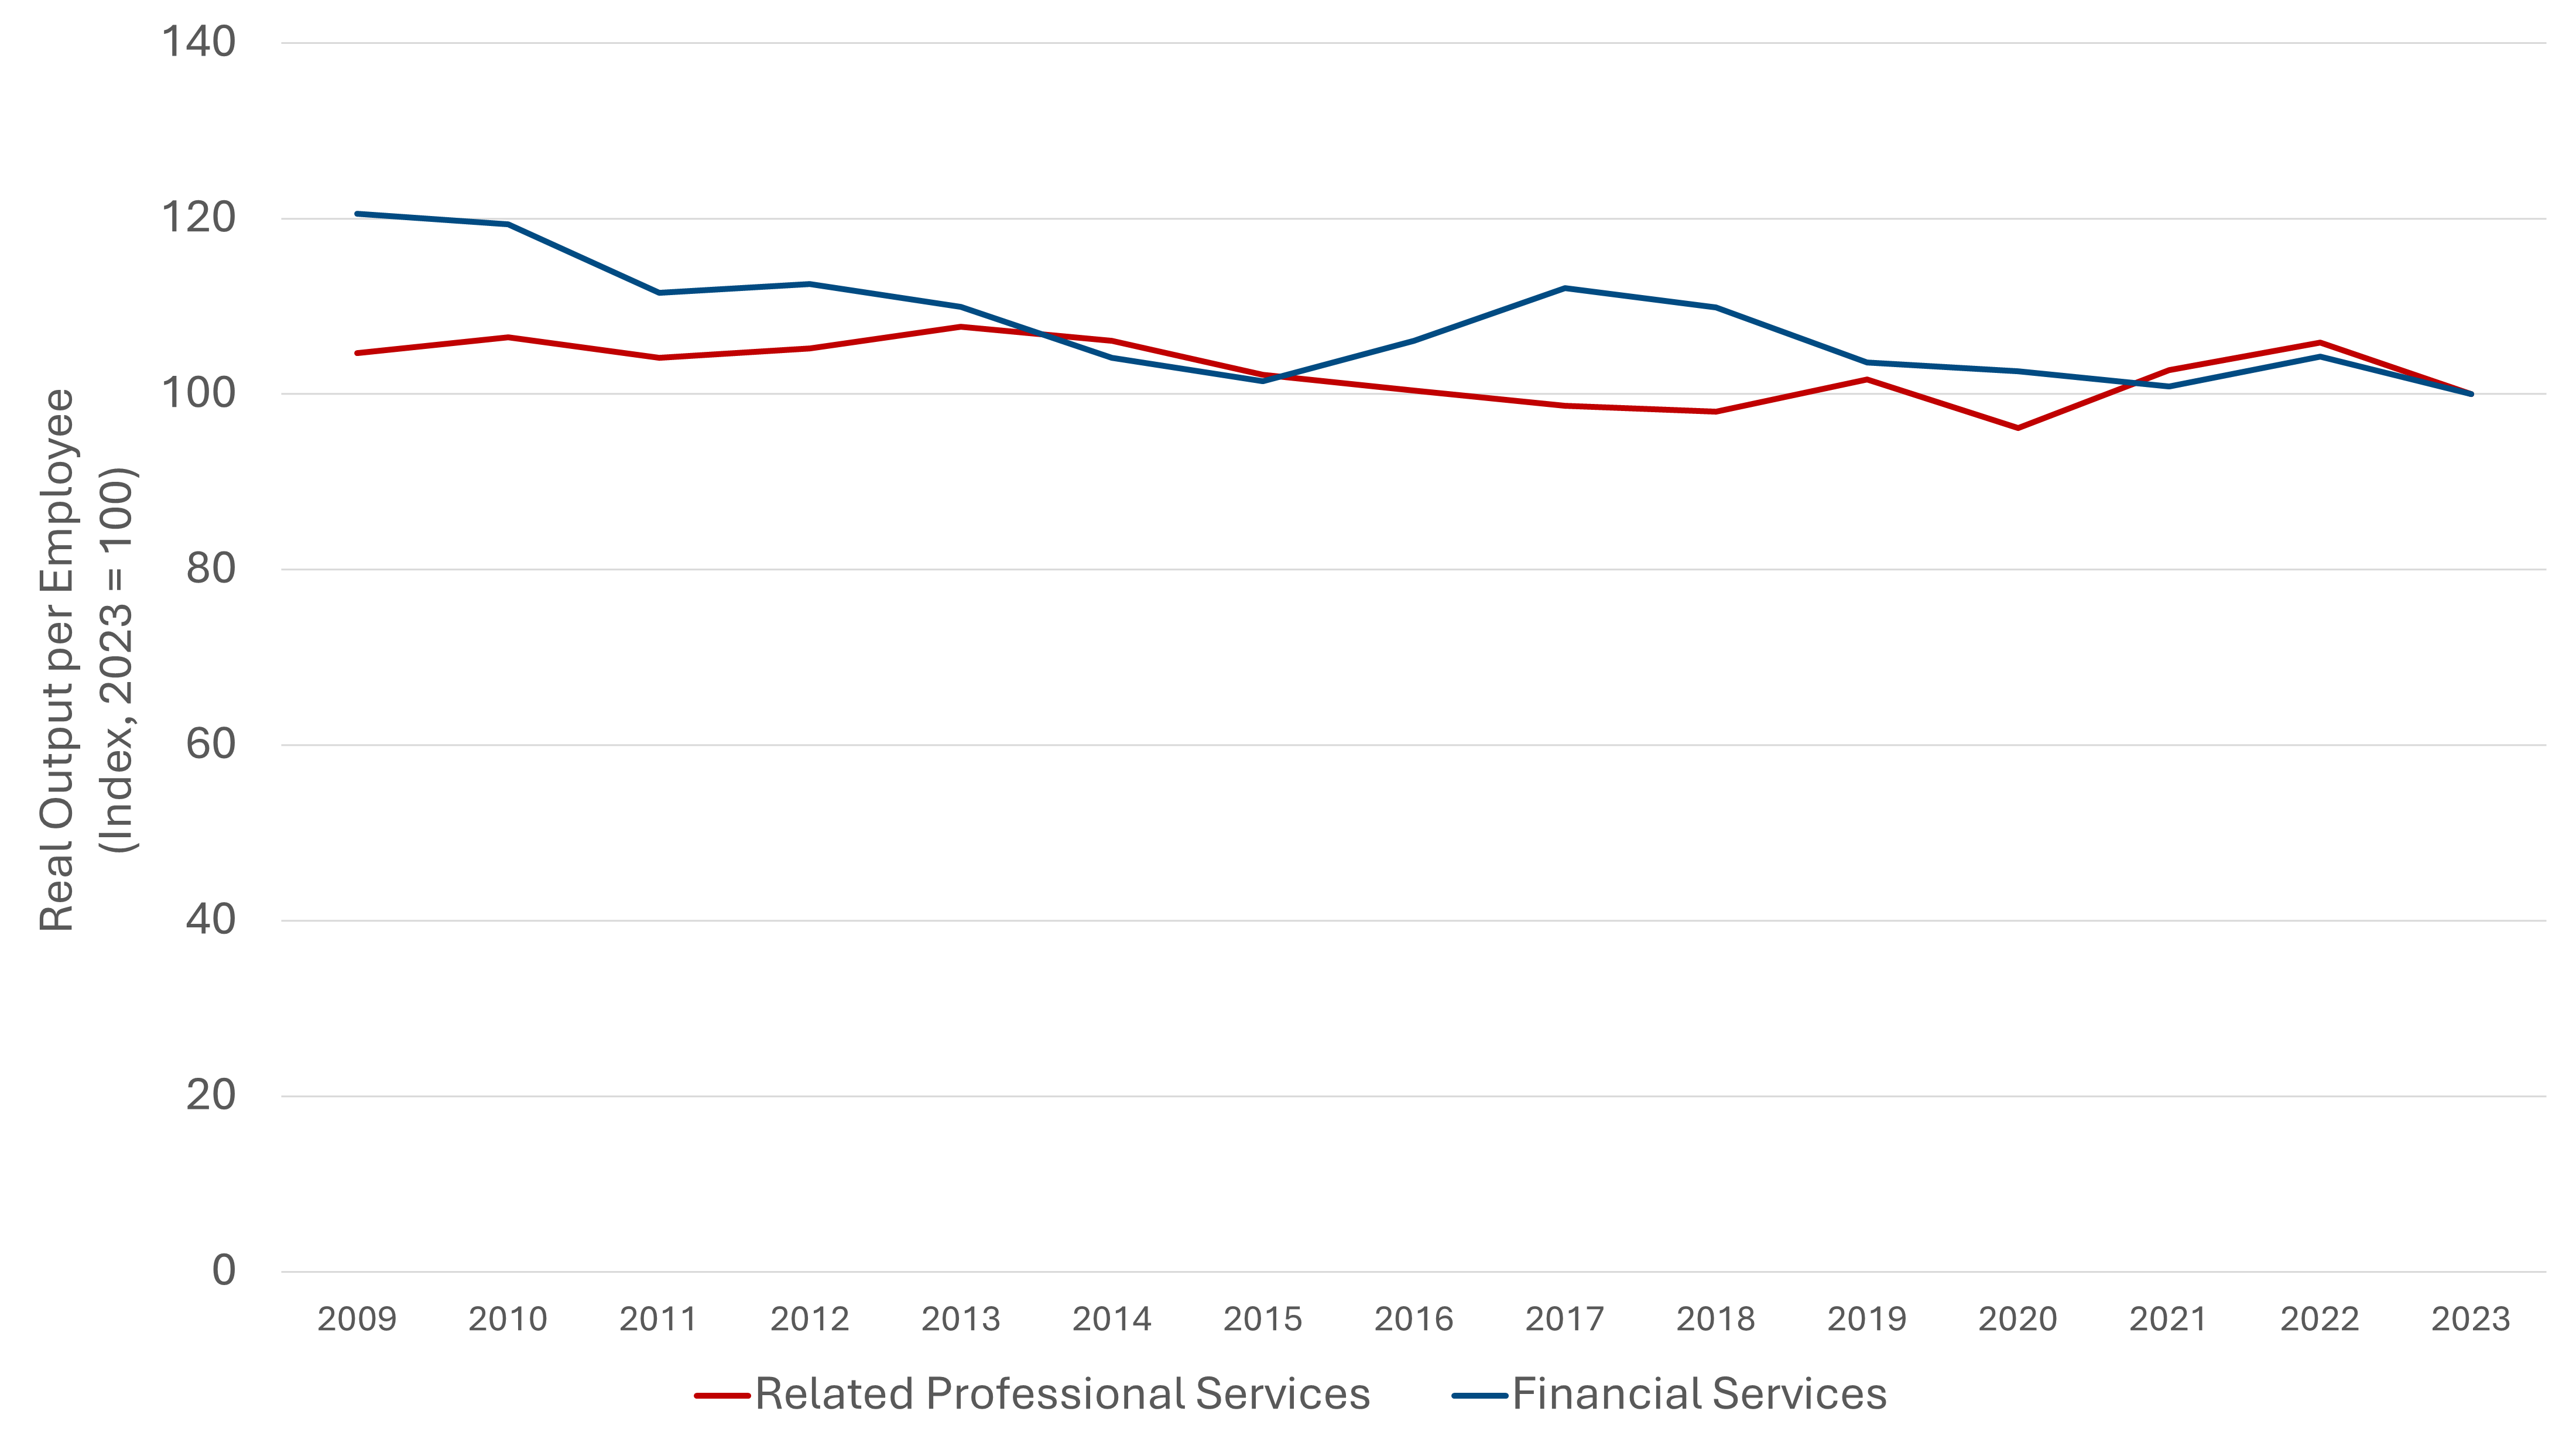
Note: productivity is measured as output per employee because the output by job data included only the very broad category ‘Professional, scientific and technical activities’.
The related professional services data is, however, broader than legal, accounting and management consulting services, because management consulting is not treated separately in the official data. Using this broader definition of the sector, we can see the related professional services productivity has declined less markedly than financial services productivity.
A new dataset from research published by the Economic Statistics Centre for Excellence[1] does offer a more detailed sectoral view. This allowed us to compare productivity levels across the different financial and related professional services sectors. The results are in the chart below, which shows how much higher productivity is in financial services than in related professional services. However, their data are not adjusted for inflation, which means that we cannot compare the data across years.
Nominal output per job, 2023 (£)
Source: Economic Statistics Centre of Excellence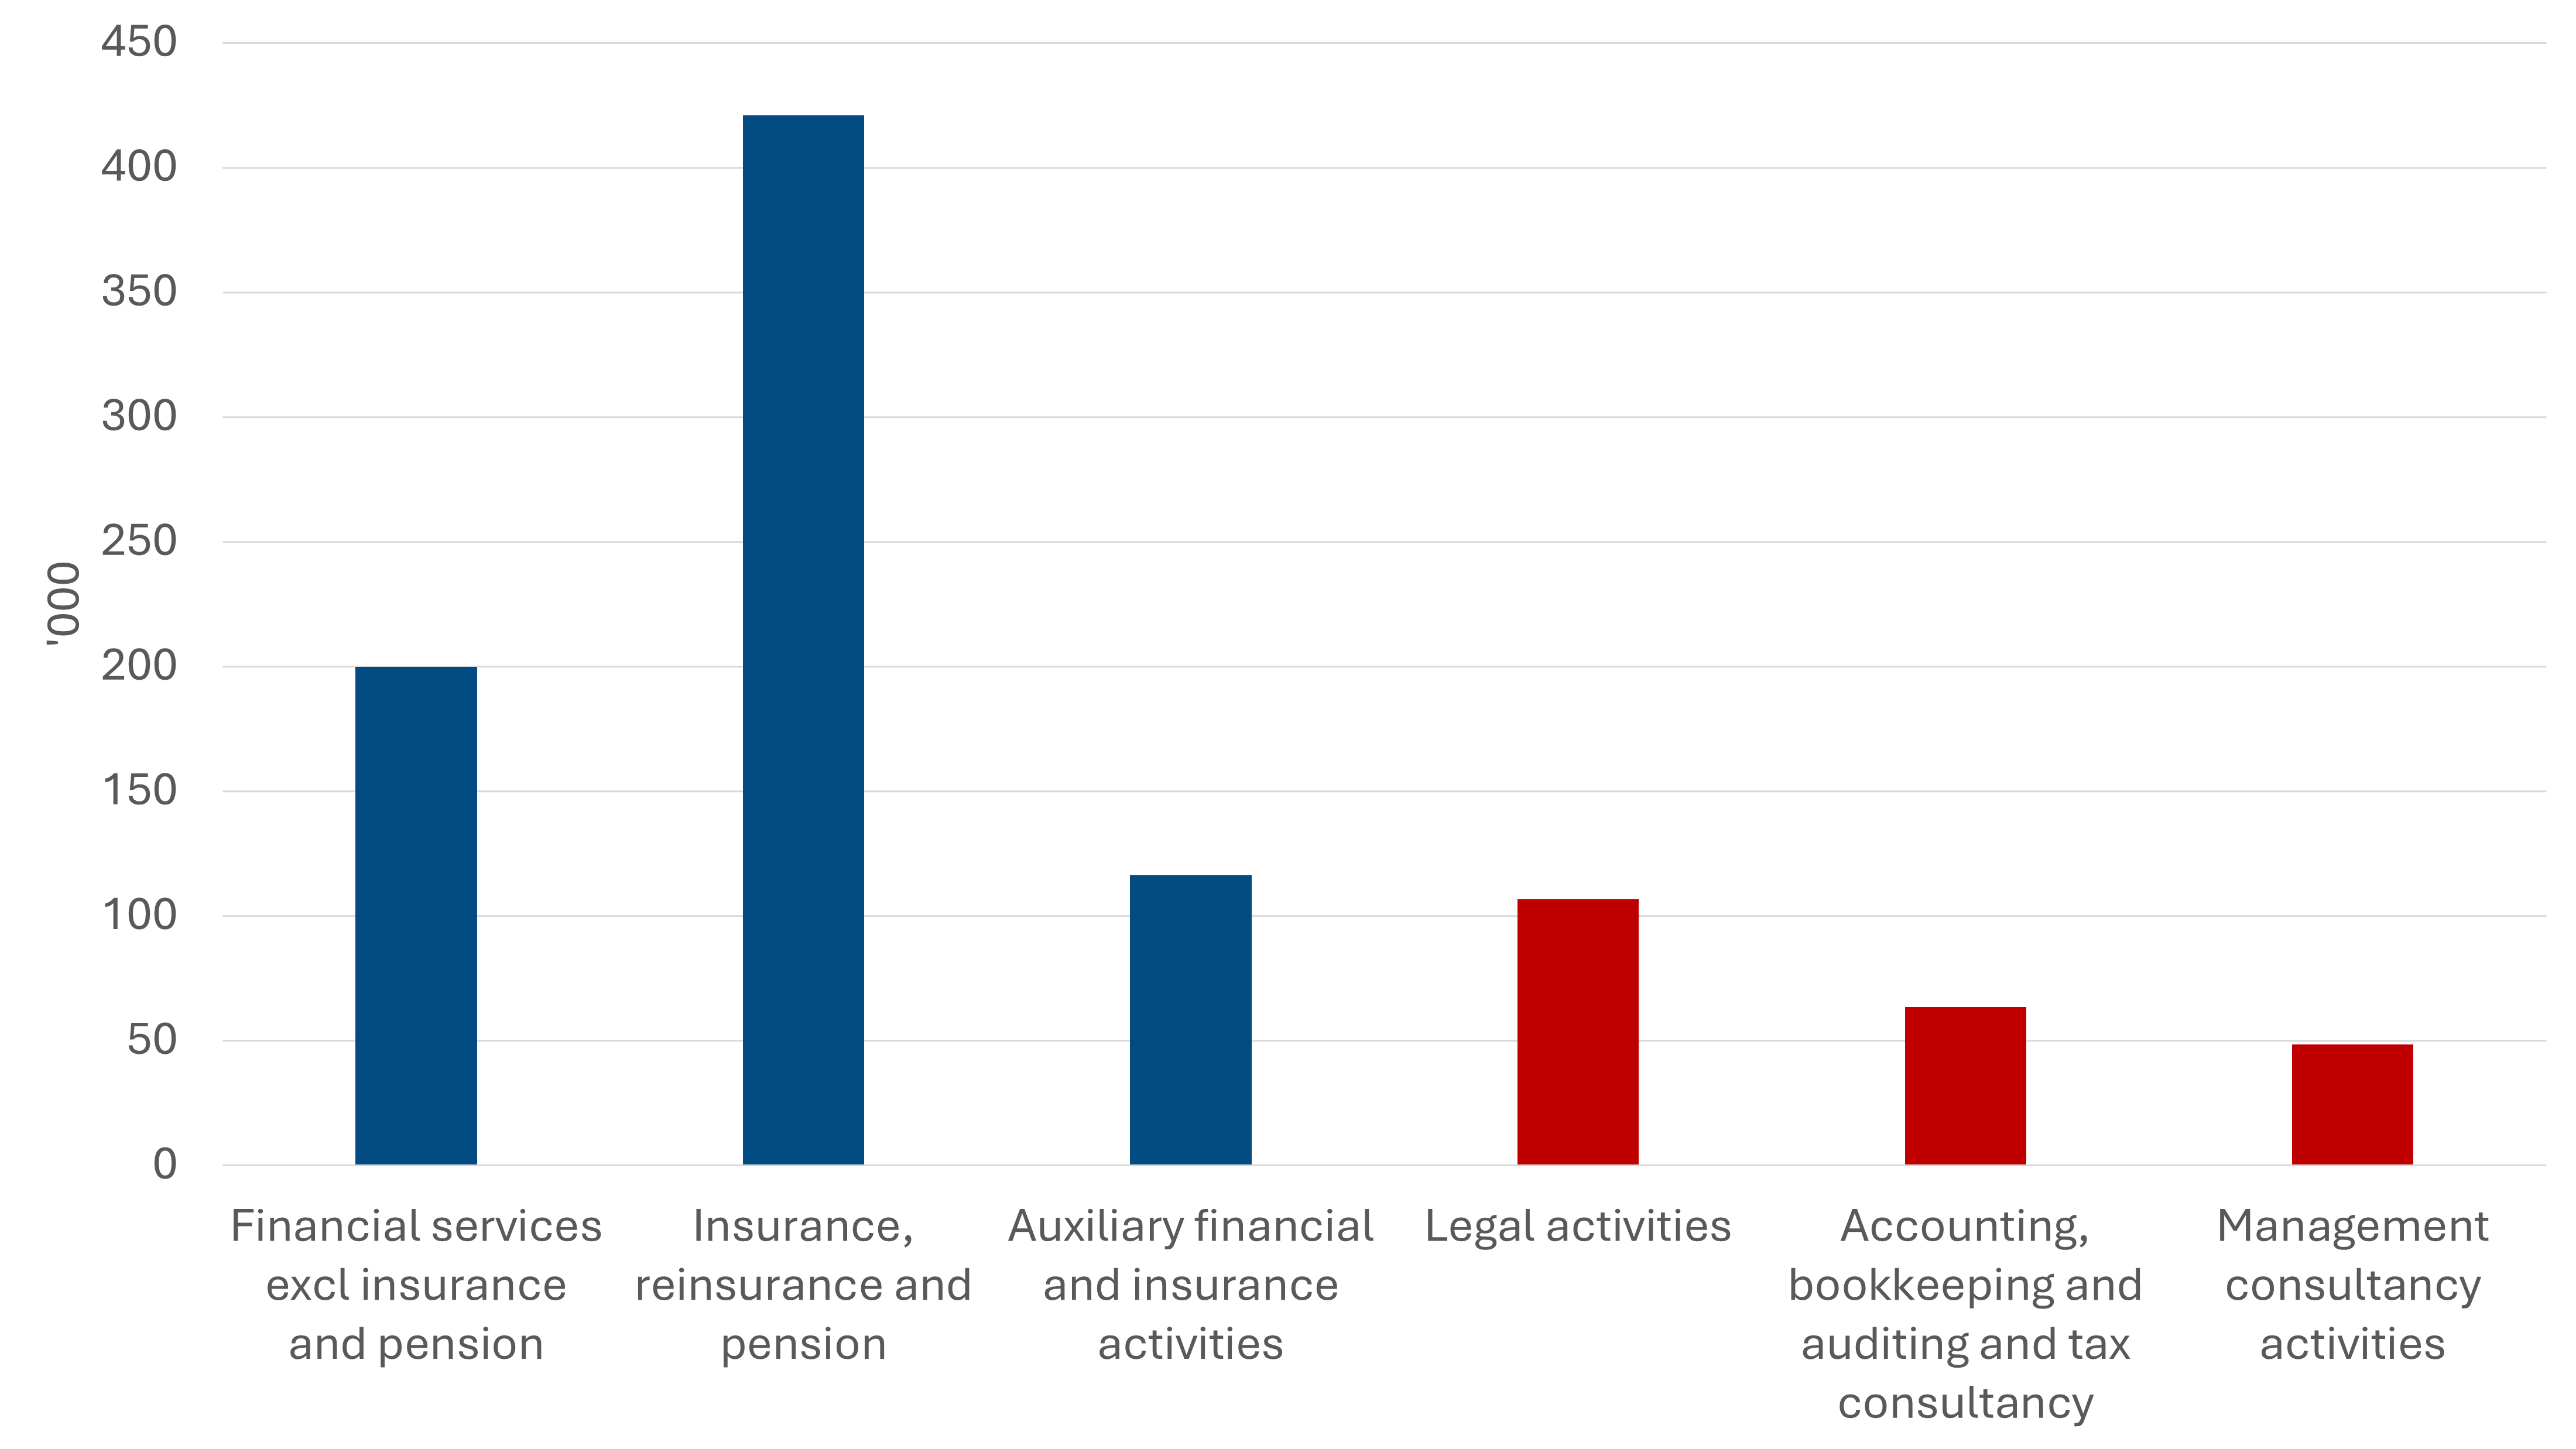
Taken together, these findings underline the complexity of productivity performance across financial and related professional services. Financial services continues to outperform the wider economy on every major productivity metric, but the gradual narrowing of this gap is as an important warning signal about the sector’s performance going forward. Different measures—output per hour, per job, and per employee—each shed light on distinct dimensions of the story, revealing how shifts in employment patterns and broader economic dynamics can affect headline productivity trends. While financial services productivity has softened, related professional services have shown greater resilience in its productivity, and new datasets can offer opportunities for even deeper insight into the drivers of performance at a more granular level.
[1] ‘Labour productivity estimates for detailed industries in the UK, 2009 to 2023’. Josh Martin and Cliodhna Taylor ESCoE Technical Report No. 32 October 2025. Available from: ESCoE-TR-32.pdf
