A look at why methodological differences shift the numbers behind the UK’s key trading relationships – but not the narrative.
In my last blog post I referenced our recent research in partnership with PwC- ‘No time to lose: Reasserting UK leadership in financial and related professional services’. One of the key points of this report was the uniquely international orientation of the financial and related professional services industry in the UK, relative to the industry in other global financial hubs. One measure of this is the strength of industry exports, which go predominantly to other developed countries, as the chart below illustrates:
UK financial and related professional services exports by destination, £bn (nominal), 2017 vs. 2024
Source: Office for National Statistics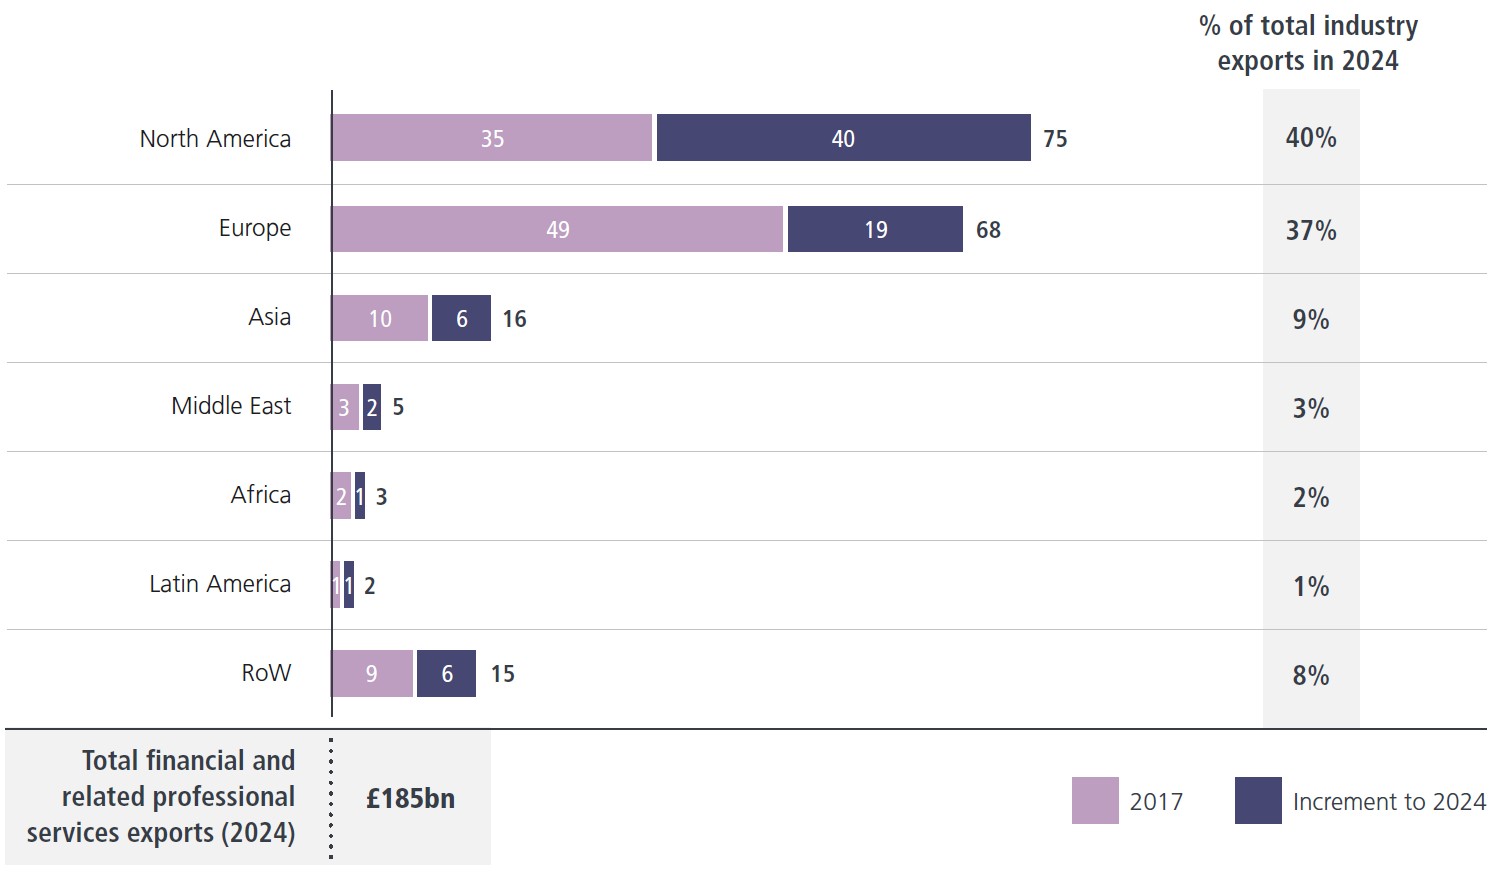
Our most recent Economic Research report also makes this point. Our annual update of ‘Key facts about the UK as an international financial centre’ notes that in 2023, the US alone accounted for 35% of UK financial and related professional services exports—the largest single-country share, and a larger share than the EU, as the bloc accounted for a collective 31% of UK industry exports.
UK financial and related professional services exports by major destinations, % of world, 2024
Source: TheCityUK calculations based on ONS data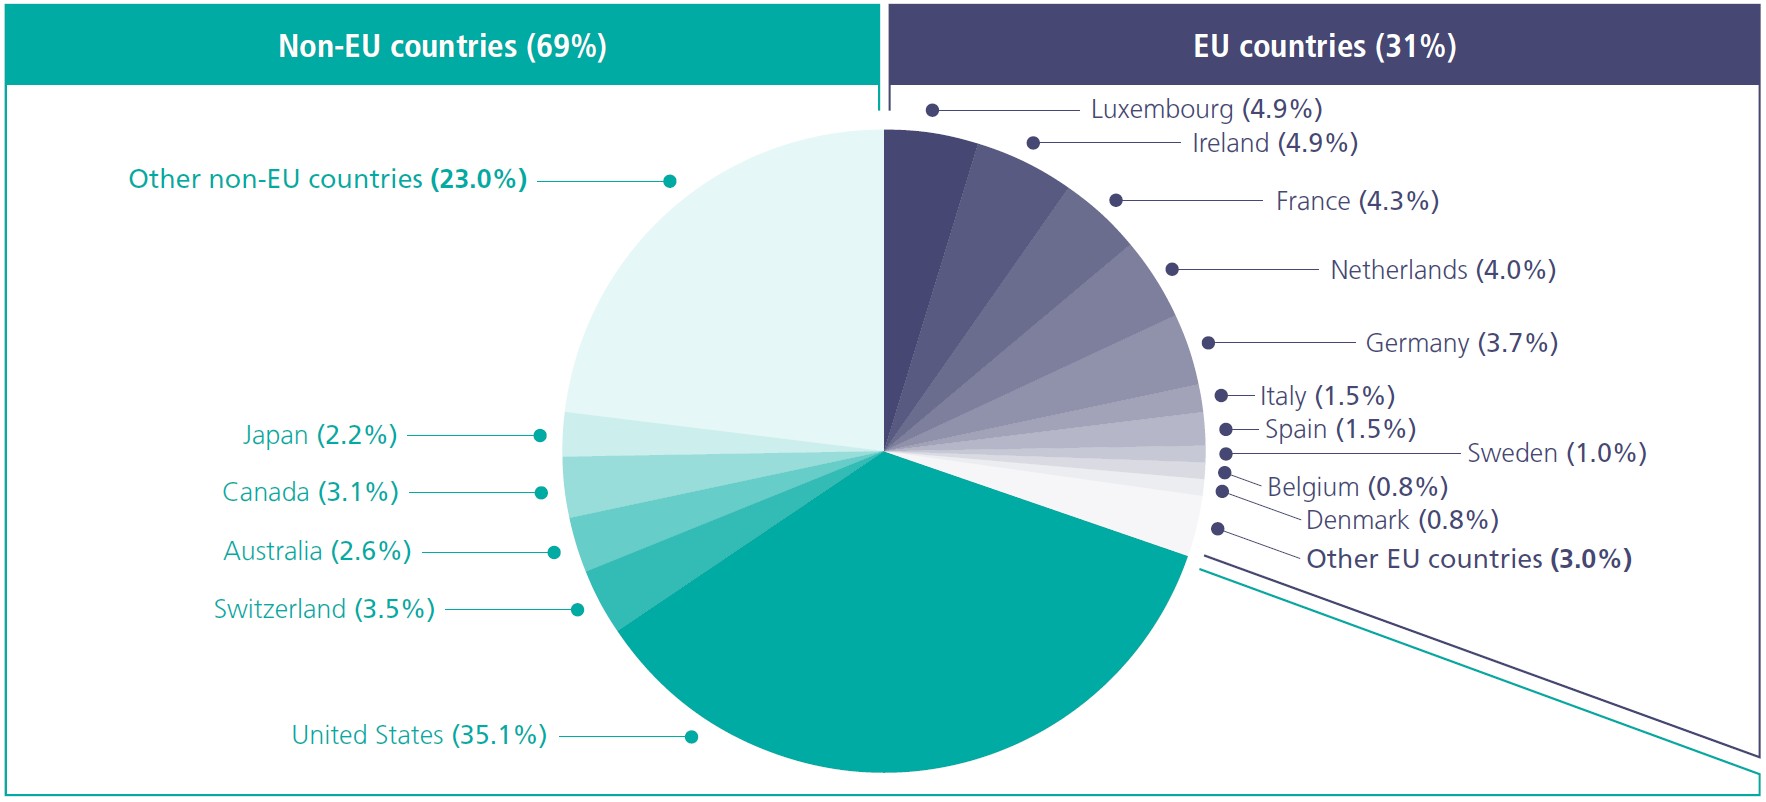
ONS data shows the US as the largest destination for UK financial services exports…
The data for financial services are almost identical to those for financial and related professional services. According to the latest available data published by the Office for National Statistics (ONS) in January, UK financial exports to the US made up 33.2% of the total in 2023, while financial services exports to the EU accounted for 30.6%.[1]
New analysis that we have just undertaken using OECD statistics paints a different picture of the UK’s financial services trade.[2] The OECD Balanced Trade in Services Statistics (BaTIS) dataset enables a deeper understanding of global trade patterns because it incorporates estimations to reconcile balance-of-payments asymmetries.
I have previously written about these asymmetries here and here. In short, they describe the situation when one country’s recorded trade flows do not match the corresponding flows recorded by its partner country. This can happen for many reasons, alone or in combination—for example, because of differences in definition (scope), or measurement methodologies.
…whereas OECD data shows the EU to be the largest destination for UK financial services exports…
Taking account of these asymmetries, the OECD figures for 2023 show that UK financial services exports to the EU represented 36.5% of the total, whereas exports to the US represented 29.4%. In 2024 (latest available data), The EU accounted for 35.7% of UK financial services exports, and the US for 29.5%:
Financial services exports from the UK to selected destination markets (2024)
Source: TheCityUK analysis based on OECD data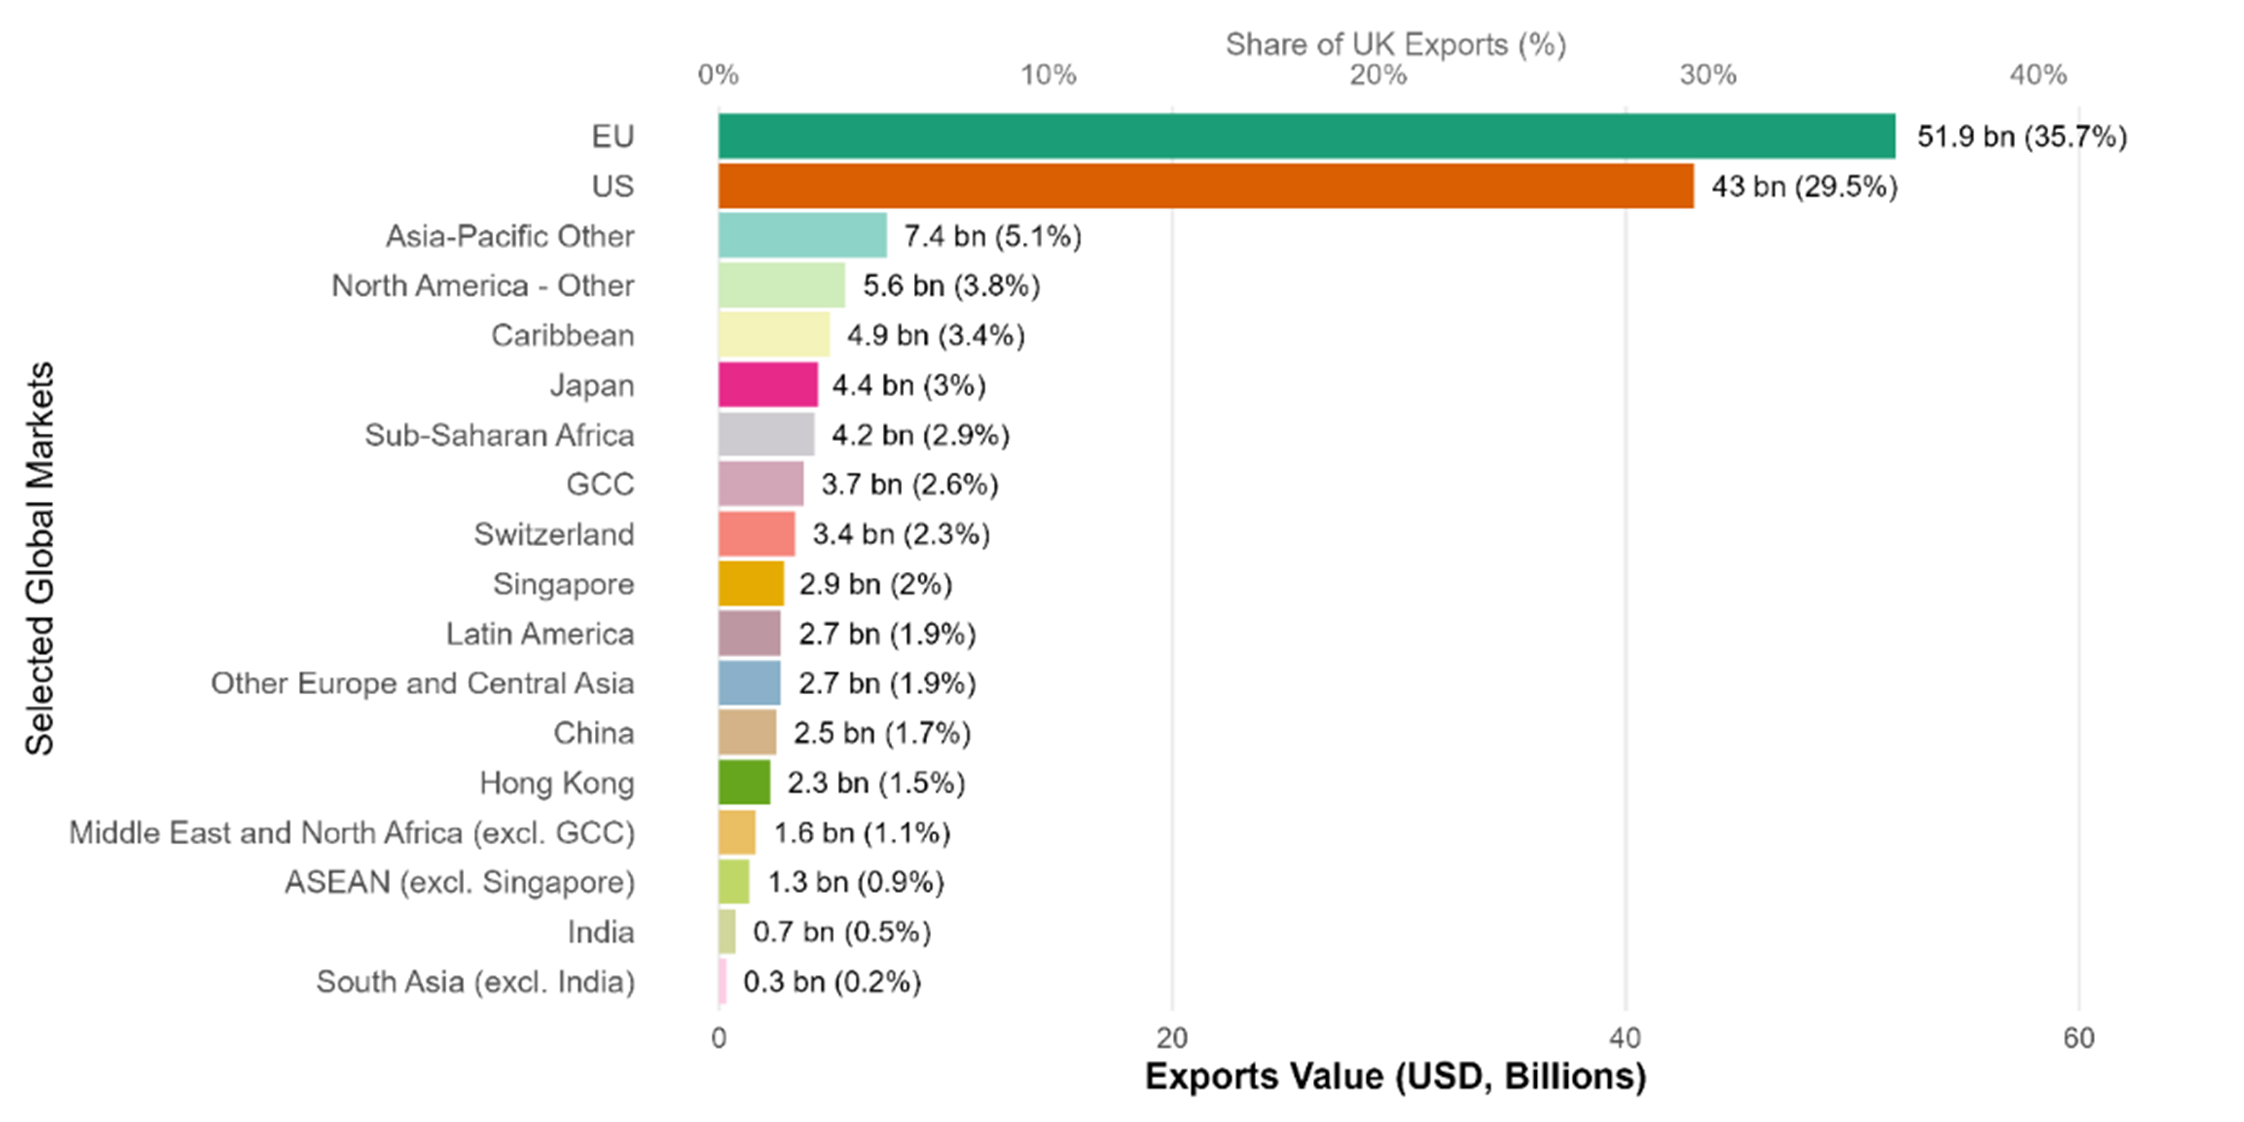
…but the differences are minimal and the two datasets are complementary rather than conflictive
Whichever way one considers it, two key points emerge from the analysis. First, the US and the EU are, by a wide margin, the largest destination for the UK’s overseas sales of financial services; these two markets represent around two thirds of total UK financial services exports. Second, the difference in position, in terms of their percentage share of UK financial services exports, is relatively small. This is true whether one considers the unadjusted ONS data, or the adjusted OECD data.
Adding financial services imports into the analysis gives a more comprehensive view…
Taking a wider view and considering total financial services trade (exports + imports), in 2024, the EU and the US each one accounted for around one third of total UK financial services trade, according to our calculations using ONS data. Again, the shares are similar using the OECD data, at 37% for the EU and 30% for the US.
…as does considering more than just a single year
Thus far, this post has looked at data for a single year. But does the picture change if we look at the trend over time? We built on the OECD data to analyse trends over 2005-2024. The chart below shows that during that period, trade values have grown steadily in both the US and the EU.
Total financial services trade (exports + imports) between the UK and main partners (2005-2024)
Source: TheCityUK analysis based on OECD data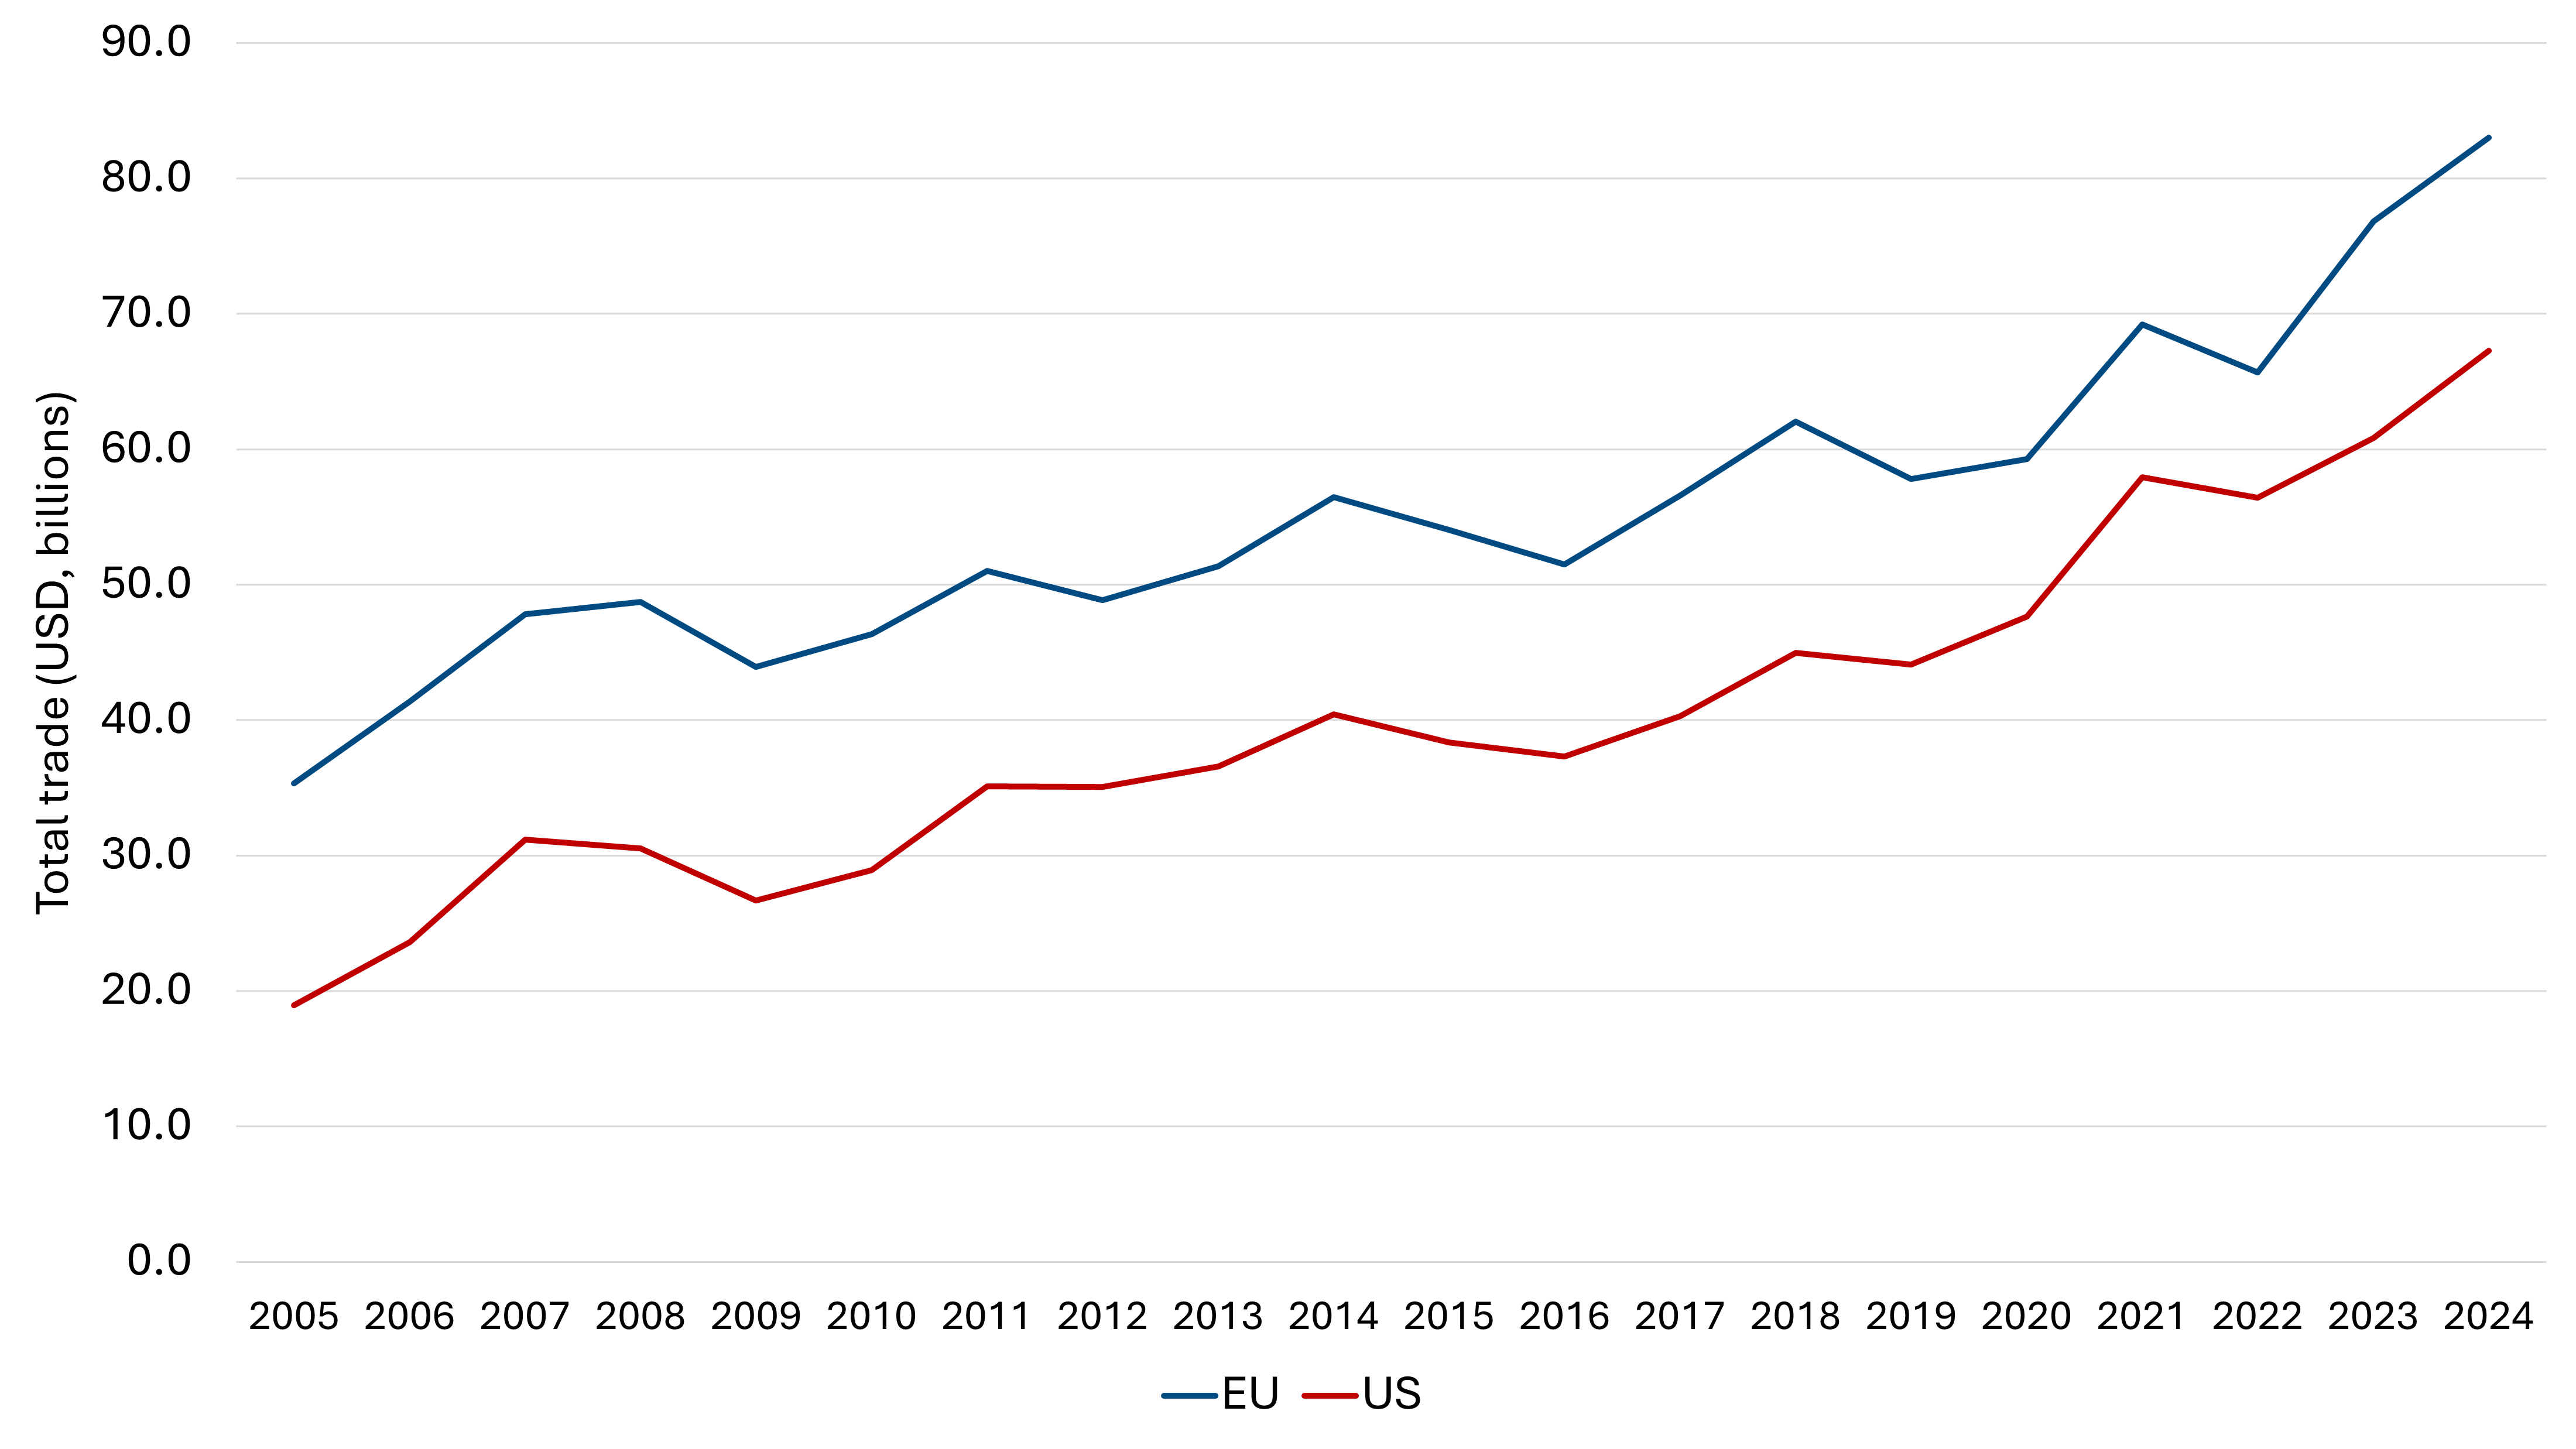
UK financial services trade with the EU increased by an annual average of 5% a year over the 20 years, and that with the US increased by an annual average of 7.5%.
To delve deeper into these two trade narratives, we compared the trend in total financial services trade between UK and its two main markets over the past eight years – the longest period of time where a like-for-like comparison using the two different datasets was possible. The results, shown below, are that without adjusting for the asymmetries (the ONS data), trade with the US has been very marginally higher than trade with the EU since 2021. When the asymmetries are adjusted for (the OECD data), the EU is recorded as the UK’s largest trade partner in financial services over the whole period.
Total financial services trade, UK-EU and UK-US, 2016-2024
Source: TheCityUK analysis of ONS and OECD data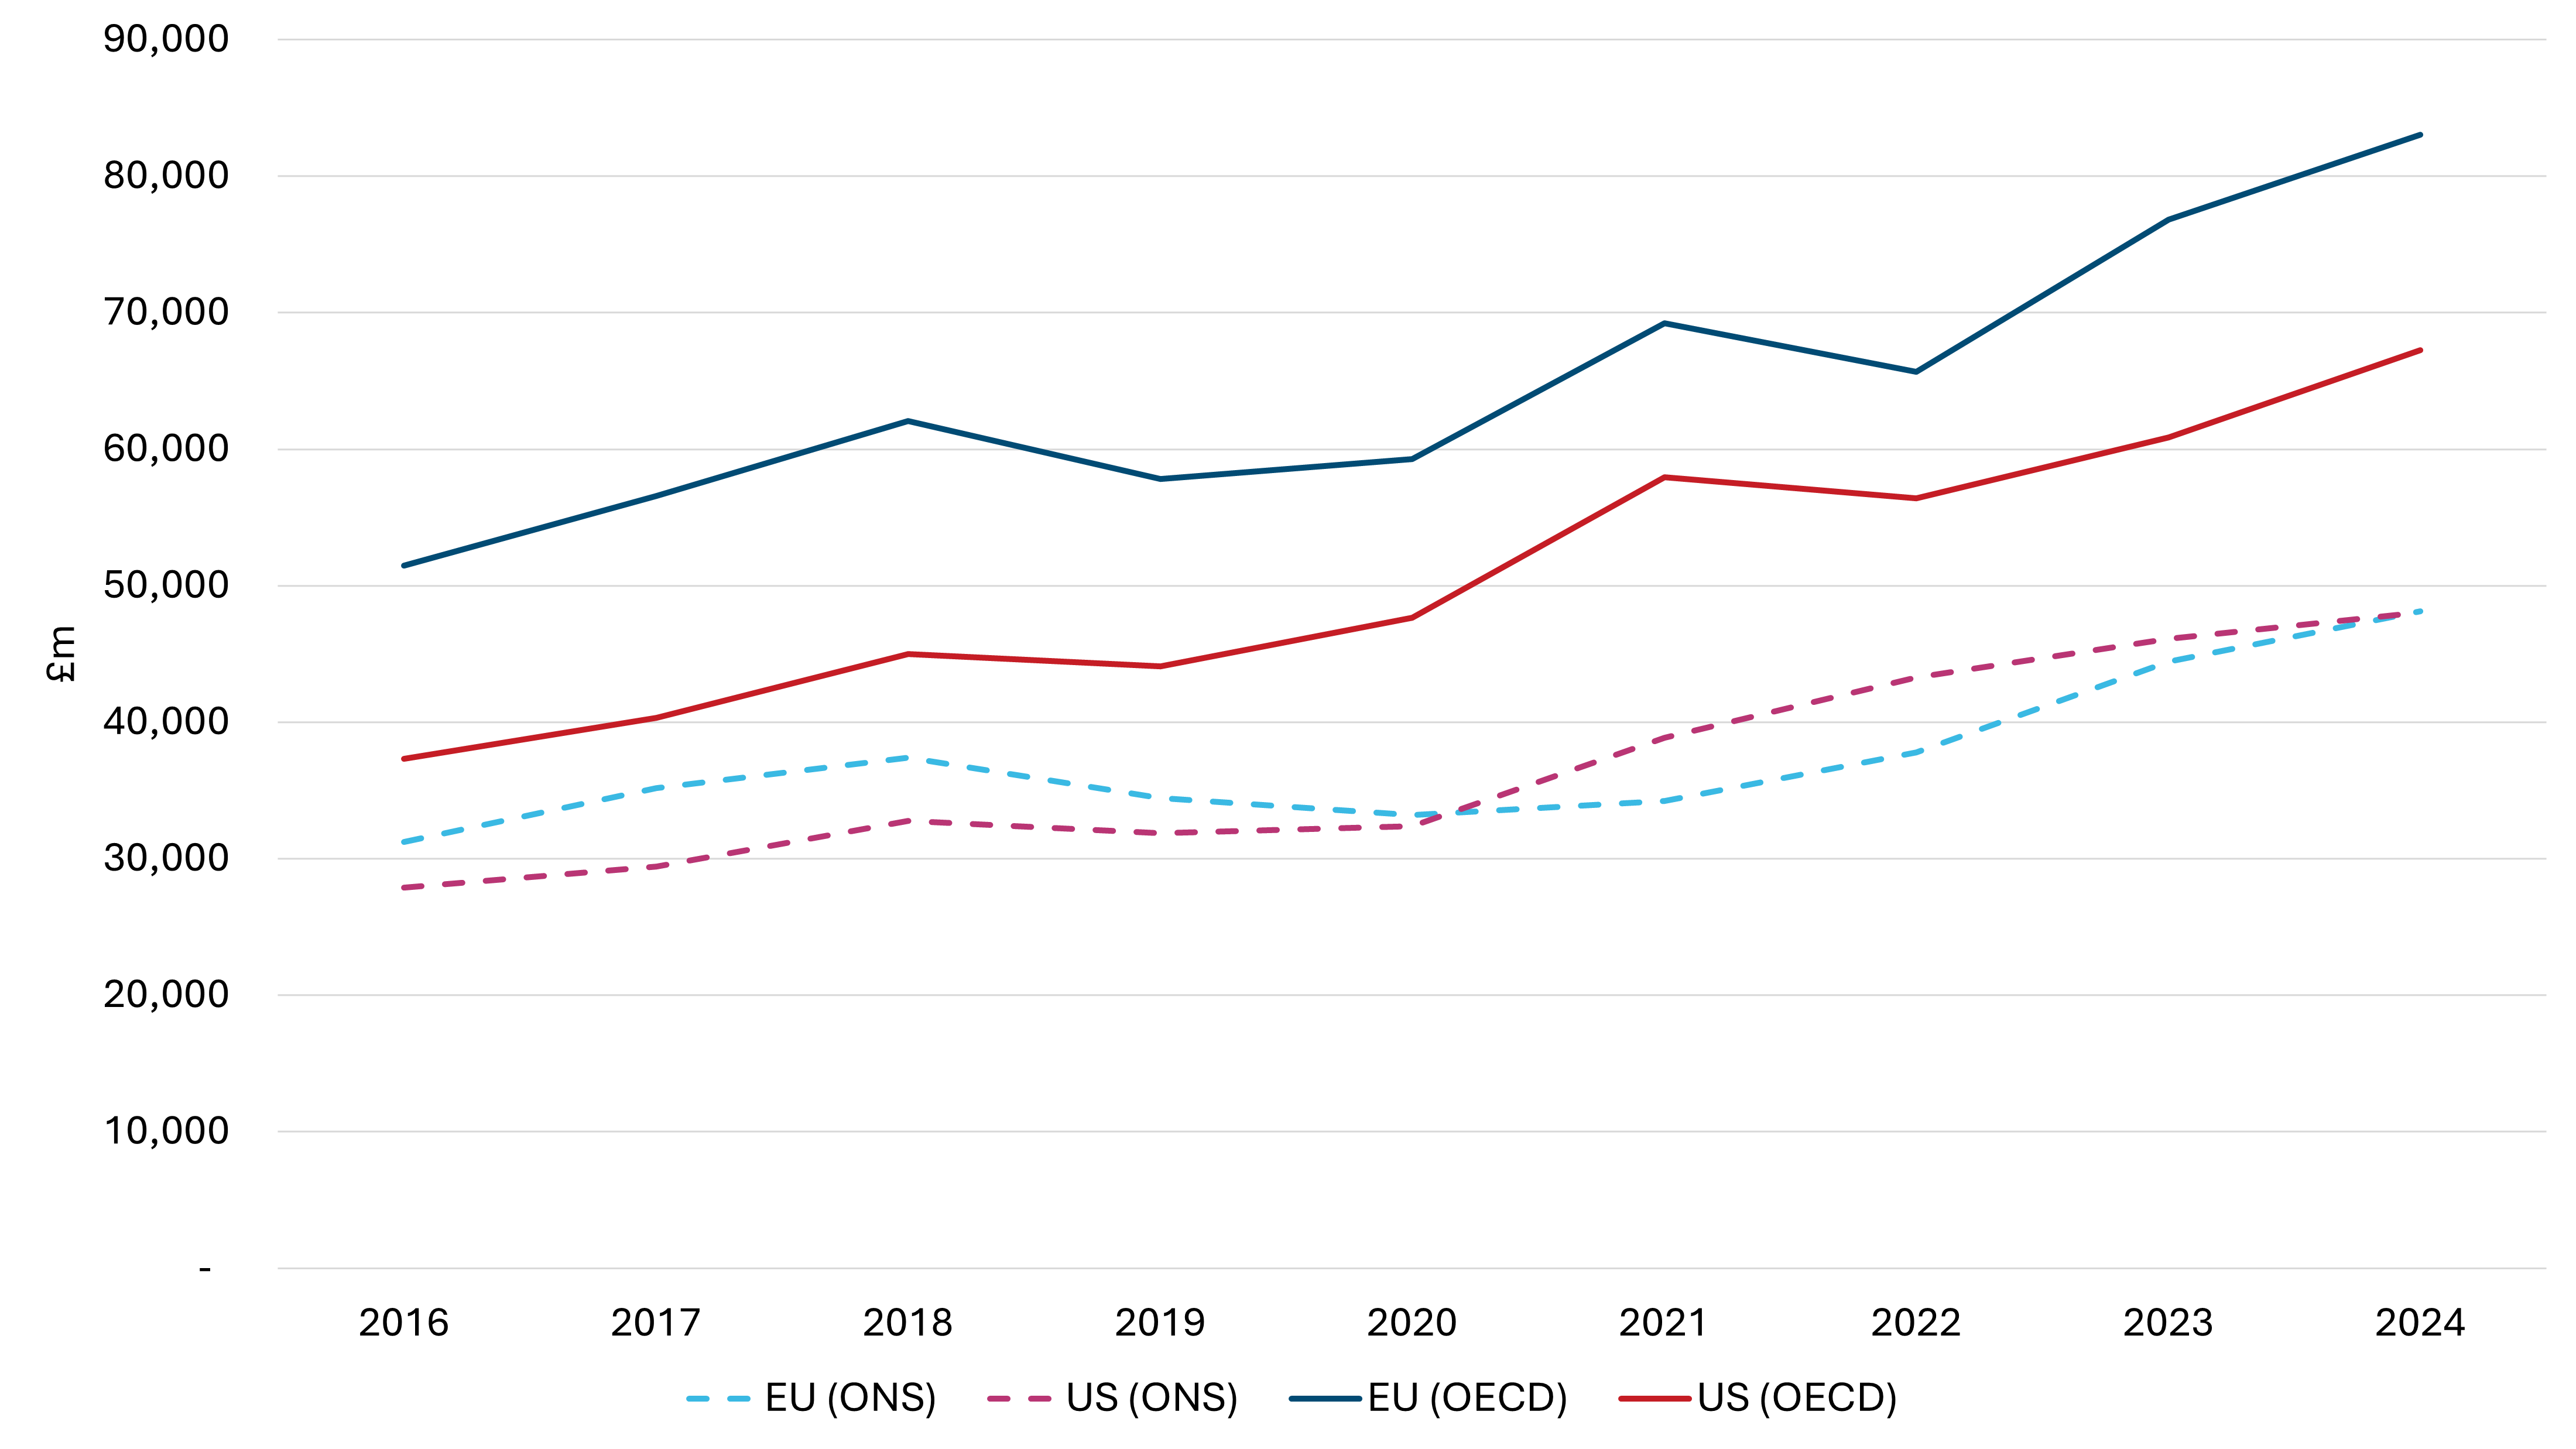
The similarities are more striking than the differences, reinforcing the point that different methodological approaches shed additional light on an issue where precise quantitative measurement is inherently impossible. As such, the two datasets are complementary rather than in conflict. In 2024, the EU and the US each one accounted for around one third of total UK financial services trade, according to our calculations using ONS data. The shares are similar using the OECD data, at 37% for the EU and 30% for the US.
Looking beyond the EU and US, other Advanced Economies are especially prominent financial services trade partners for the UK
Meanwhile, this chart shows how scale and growth interact across selected markets, with the bars reflecting scale (financial services exports + imports in the aggregate over the 20-year period) and the average annual growth rates displayed alongside each bar.
Cumulative financial services trade (exports + imports) between the UK and selected partners (2005-2024)
Source: TheCityUK analysis based on OECD data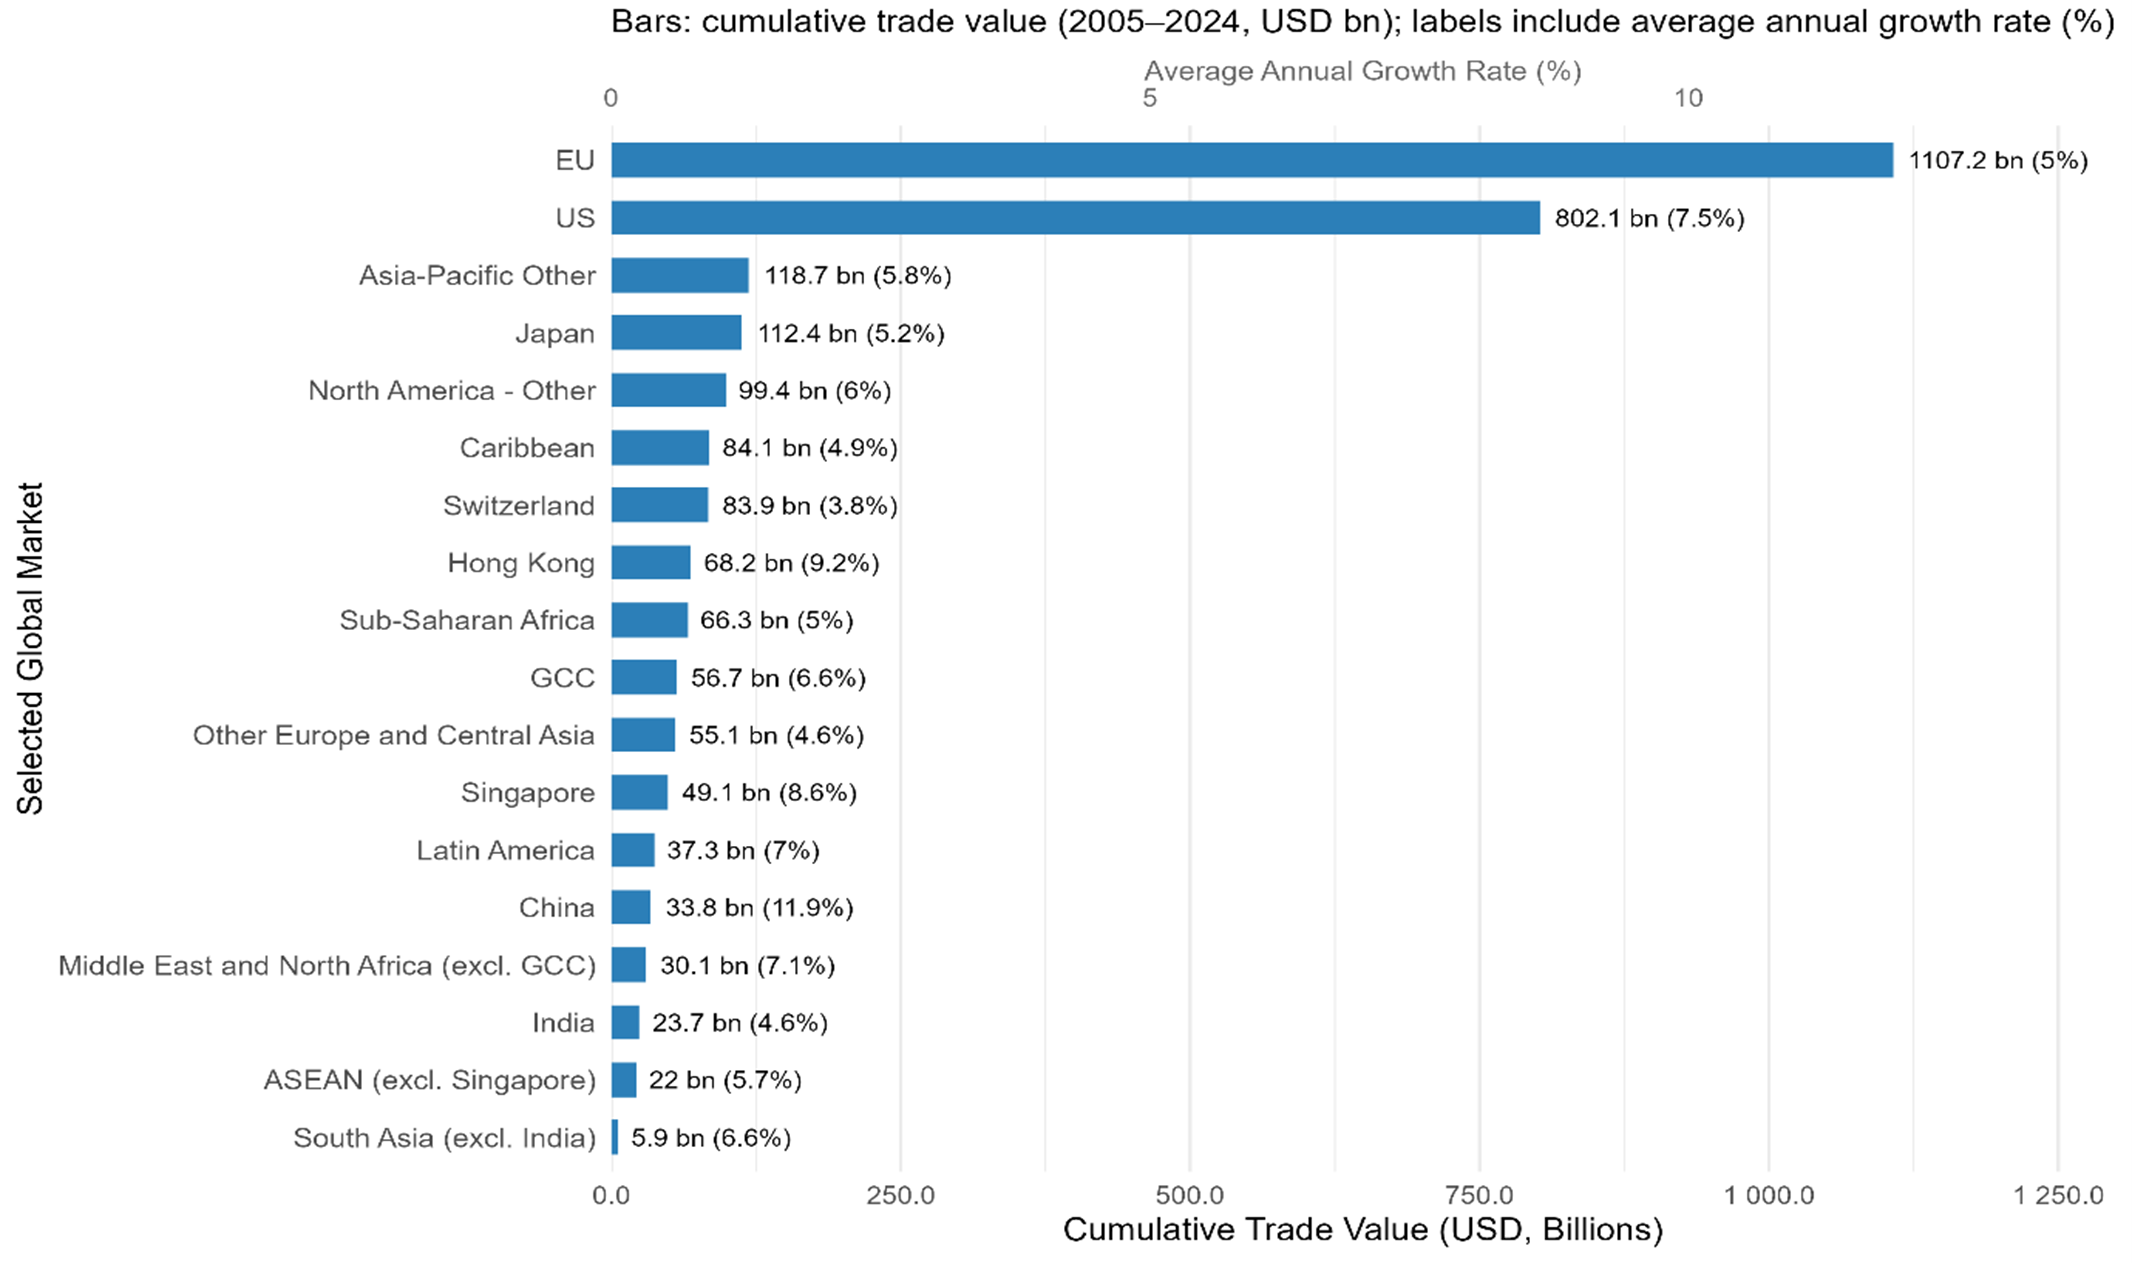
A number of things are apparent here. One thing to note is that comparing UK exports only for 2024 (the first bar chart in this blog post) and total financial services trade over the 20-year period (the much broader view shown in the bar chart immediately above), the rank order of major partner countries is almost unchanged. Another important conclusion is that the OECD data reinforce the analysis in our ‘No time to lose’ research with PwC, which emphasised the centrality of Advanced Economies as partners for UK financial (and related professional) services trade.
Finally, looking at scale and growth of total trade together, it is clear that the US and the EU account for the vast majority of growth in total UK financial services trade over 2005-2024—even though some other, smaller markets experienced much faster growth rates. For example, UK financial services trade with China rose by an annual average of 11.9% over the period—but their cumulative value was $33.8bn, compared with a cumulative value to the US of $802.1bn.
This dynamic—the combination of vast scale and still-robust growth—means that the US and the EU each accounted for around one-third of the total growth of total UK financial services trade between 2005 and 2024. The figures in the treemap below are percentage points, not percentages; they represent the contributions to 167.5% total growth of financial services trade:
Partner market contributions to growth of total UK financial services trade (exports + imports) over 2005-2024
Source: TheCityUK analysis based on OECD data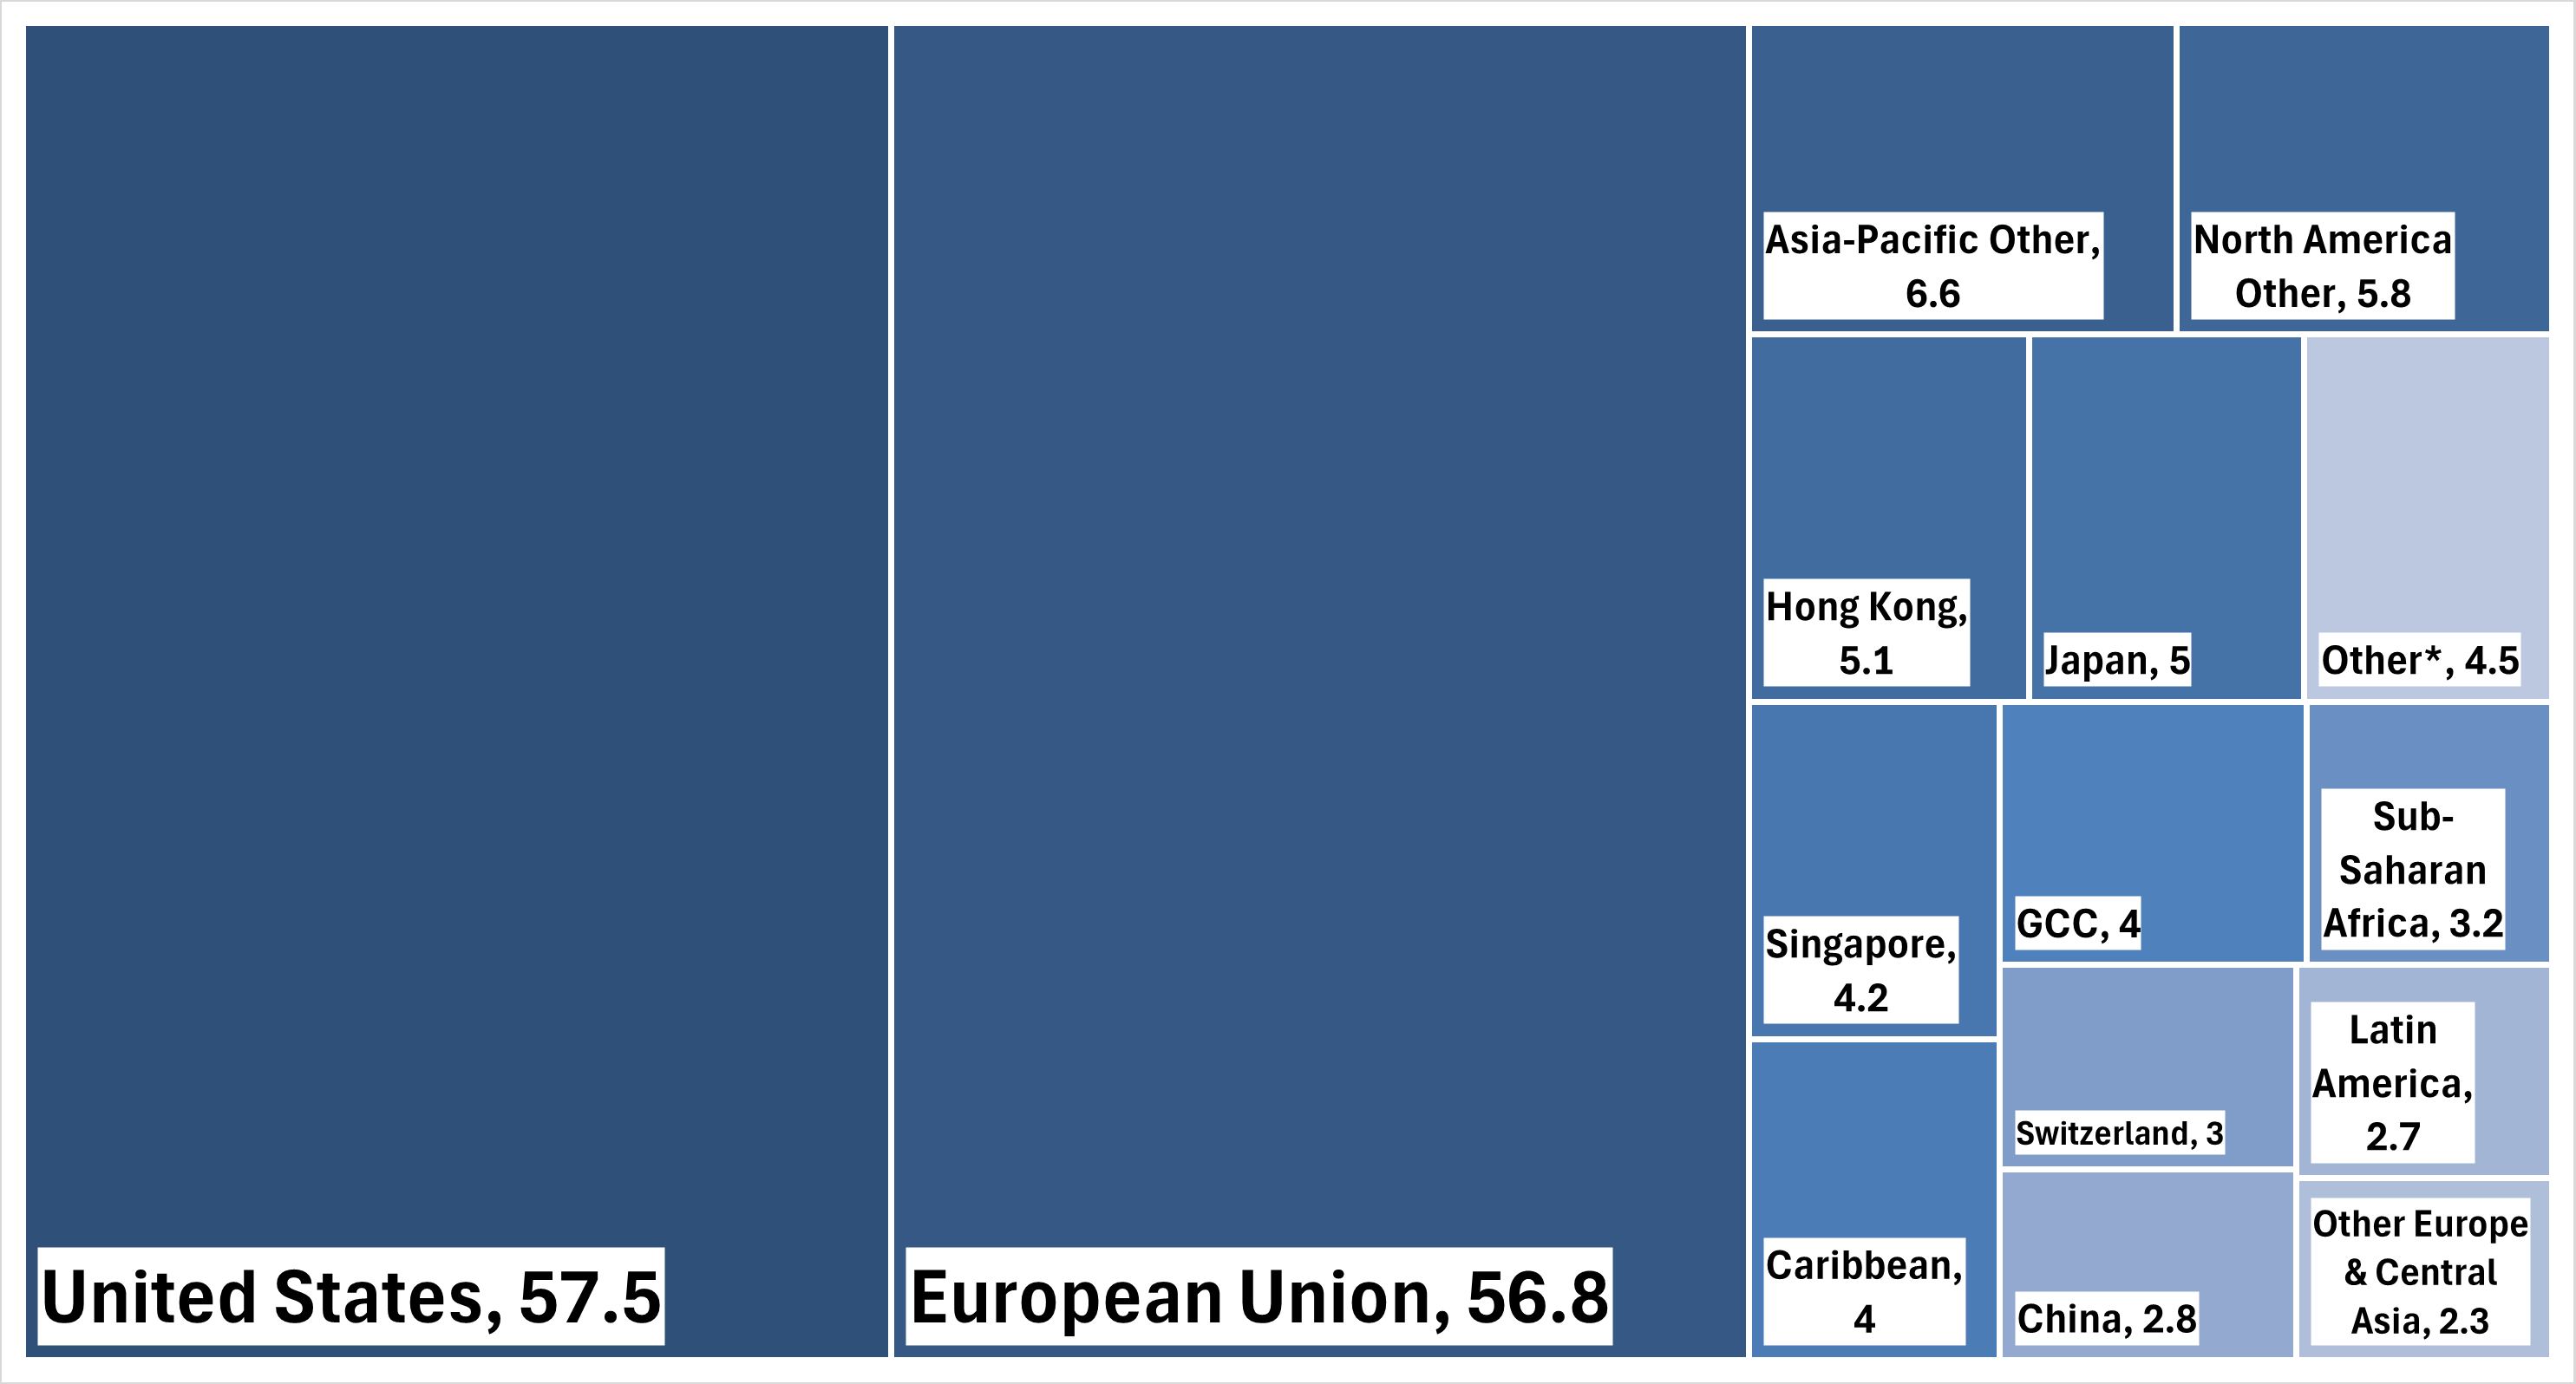
* Other includes Middle East & North Africa, ASEAN (excl. Singapore), and South Asia
This highlights both the resilience of established corridors, and the challenge of translating high growth rates in some smaller, more dynamic markets into meaningful contributions to overall financial services trade.
The ONS and OECD datasets which we have used to consider UK financial services trade use different methodologies to address well-known, universal challenges in services trade measurement. It might appear that they tell conflicting stories, with one dataset showing the US and the main trading partner for UK financial services and the other showing the EU to hold that role. In fact, the story they tell is consistent: the UK’s financial services trade remains deeply anchored in its corridors with its largest Advanced Economy partners, and this has not changed over the past 20 years. The methodological differences shift the precise rankings, but the differences in these precise rankings are minimal, and so the differences do not alter the fundamental point about the magnitude and direction of financial services trade. Some high-growth emerging markets may be expanding at faster rates (both in terms of economic growth and in terms of financial services trade), but their scale is still very far from altering the overall trade dynamic being considered. This highlights an advantage to be safeguarded, since the trade growth with major Advanced Economies has been more stable and less volatile than with other markets. It also presents a strategic challenge: how to enable smaller, high‑growth markets for financial services to evolve into more meaningful contributors to the UK’s industry trade footprint.
[1] These data are based on TheCityUK estimates for UK insurance and pension services exports to the US, as the ONS classified this figure as confidential in 2023.
[2] OECD, ‘Balanced Trade Statistics’, available at: https://www.oecd.org/en/data/datasets/oecd-balanced-trade-statistics.html
