Better insight into business and economic conditions might allow early interventions to assist distressed firms, or longer-term policy changes where appropriate.
Last year I wrote about an innovative new way in which economic analysis was being undertaken. (The new tracker that I flagged subsequently went on to become a widely-cited new economic indicator, featured in The Economist, the Financial Times and other prestigious media outlets.) The weekly GDP tracker that I wrote about was an innovative approach to macroeconomic analysis, but I’ve just had the opportunity to explore another way in which data analytics can potentially be used to provide greater insight into economic and business conditions—this time, on the micro side, and looking in detail at the UK’s regions and nations.
Quantuma, a high-growth advisory firm, launched their new data asset Clarity at an event in Manchester several weeks ago. In combination with my presentation of TheCityUK’s latest annual research highlighting the economic contribution of the financial and related professional services industry in each region and nation, the discussion at the event offered a fascinating glimpse into what policymakers might be able to achieve by combining macro and micro data.
Our regional report, launched in early September, features official data from the Office for National Statistics about the spread of industry employment across the UK. Two thirds of financial and related professional services employment is outside London, and cities such as Birmingham, Bristol and Manchester have a significant industry presence and clusters of sectoral expertise. Taking official data as a starting point, we also published our own estimates of the industry and sectoral contributions to each region’s economic output (GVA).
For the first time, we included in this year’s report analysis of industry employment and GVA trends over the past decade. Here, for example, you can see that the industry employment level was higher in 2020 than a decade earlier in nine out of the 12 regions. But even for the regions where industry employment has seen a positive trend, there was considerable variation over the period. Some regions saw relatively steady industry employment growth over the decade, whereas some saw much more year-to-year volatility.
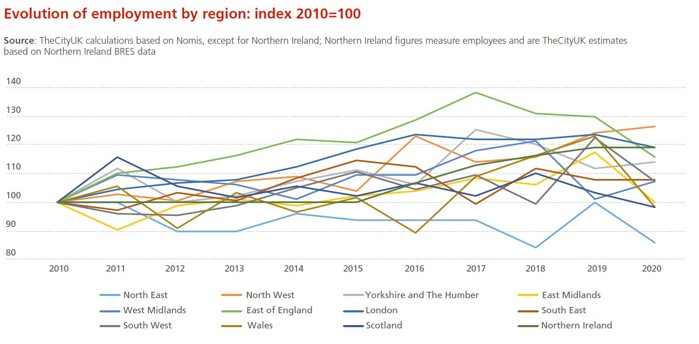
Data like this is extremely important for painting an overall picture of the strength and spread of the industry. It also provides a picture of the medium-term trend, allowing us to establish whether industry employment (or output) is, in broad terms, rising or falling. What it cannot do, however, is provide any detail about more recent, more detailed trends on the ground—for example, to answer questions about why employment in, say, insurance or accounting increased or decreased in a given region in a given year.
For this kind of insight, we need microeconomic data and on-the-ground insight. For example, one insight from the discussion in Manchester was that the strength of relationship-based business in the North West relative to London may partly explain the relative resilience of financial and related professional services activity in that region even in an economic downturn.
I concluded my speech in Manchester by presenting this slide.
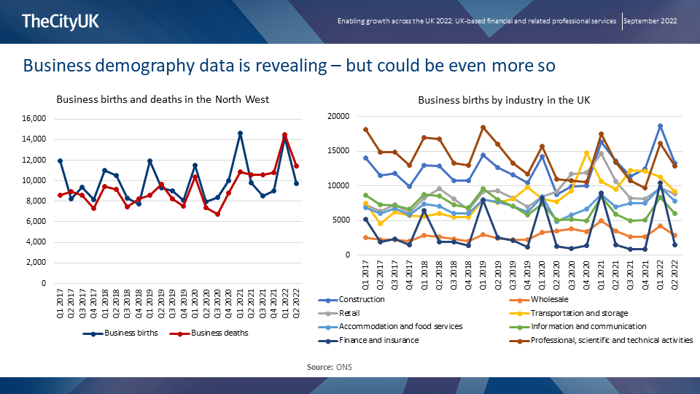
The right-hand chart reveals some interesting trends in new-business creation by sector. (Similar data are available for business closures.) We can see a high degree of seasonality, with registrations spiking in the first quarter of each year (most likely because of administrative issues around starting a new business). This is evident across sectors, but most pronounced for financial services. Financial services also stand out for having the lowest level of business births—but also fairly stable levels of business creation. In contrast, professional, scientific and technical services (which includes legal, accounting and consulting services) has a much higher level of business births (most likely reflecting the prevalence of sole proprietorships and SMEs in this sector, particularly in accounting and consulting), but its trend over the past five years has been downwards.
The left-hand chart, meanwhile, shows data specifically for the North West, and here we charted both business creations and closures. But data are not available by both sector and region. Imagine the insight we could gain if we were able to see trends in business births and business deaths, by sector, in each region—not only on local business conditions, but also by comparing the trends across regions.
This is where microeconomic data can and should serve as a vital complement to macro data. For example, Quantuma’s new data asset, developed in partnership with advisory and consulting firm Laeceum, combines model-based data with business metrics like financial performance ratios to offer a picture of the business landscape that is far more granular than what can be painted with official statistics. For example, their recent research reveals that in the North overall, SMEs have a higher borrowing ratio than the UK average, but also higher levels of profitability and efficiency as measured by return on shareholders’ funds, pre-tax profit margin and return on assets. This granular data combined with model-based data enables detailed forward-looking analysis: for example, the research notes that the wholesale/retail sector has strong growth prospects relative to the sector’s prospects in other regions, and that the manufacturing sector has strong growth prospects relative to other sectors in the North. Forward-looking indicators of financial distress offer the possibility of early, targeted interventions, and/or longer-term policy changes should trends reveal that changes to the business environment might be beneficial.
It is important to note that micro data cannot and should not replace macro data. Not only do the different types of data (obviously) measure different things, but there are caveats around the use of so-called Big Data in particular (like data taken from credit-reporting agencies) with regard to use for purposes other than which they were originally intended. As with everything in economics (and in life!) there are trade-offs to be made: for example, in terms of scope and quality (for example, representativeness); and timeliness, granularity, and consistency. In an ideal world, the synthesis of both types of data could be used to provide timely, detailed insights into business and economic conditions. In the wake of the Manchester event, for example, we analysed correlations between financial services employment and financial services business births for the UK as a whole, and for individual regions—but the results were inconclusive. The ONS classifies its business births/deaths data as ‘experimental’, so further work in this vein—including work combining official and private-sector data sources—may yield stronger results. Watch this space...
